Blog
Since days when shale oil and gas technologies were discovered, the U.S. energy industry has been evolving more rapidly than ever before. Many changes are amazing especially when you put them on an industry map. At Rextag not only do we keep you aware of major projects such as pipelines or LNG terminals placed in service. Even less significant news are still important to us, be it new wells drilled or processing plants put to regular maintenance.
Daily improvements often come unnoticed but you can still follow these together with us. Our main input is to “clip it” to the related map: map of crude oil refineries or that of natural gas compressor stations. Where do you get and follow your important industry news? Maybe you are subscribed to your favorite social media feeds or industry journals. Whatever your choice is, you are looking for the story. What happened? Who made it happen? WHY does this matter? (Remember, it is all about ‘What’s in It For Me’ (WIIFM) principle).
How Rextag blog helps? Here we are concerned with looking at things both CLOSELY and FROM A DISTANCE.
"Looking closely" means reflecting where exactly the object is located.
"From a distance" means helping you see a broader picture.
New power plant added in North-East? See exactly what kind of transmission lines approach it and where do they go. Are there other power plants around? GIS data do not come as a mere dot on a map. We collect so many additional data attributes: operator and owner records, physical parameters and production data. Sometimes you will be lucky to grab some specific area maps we share on our blog. Often, there is data behind it as well. Who are top midstream operators in Permian this year? What mileage falls to the share or Kinder Morgan in the San-Juan basin? Do you know? Do you want to know?
All right, then let us see WHERE things happen. Read this blog, capture the energy infrastructure mapped and stay aware with Rextag data!
California’s Renewable Energy Isn’t as Safe as It Looks: Why Are We Wasting So Much Energy?
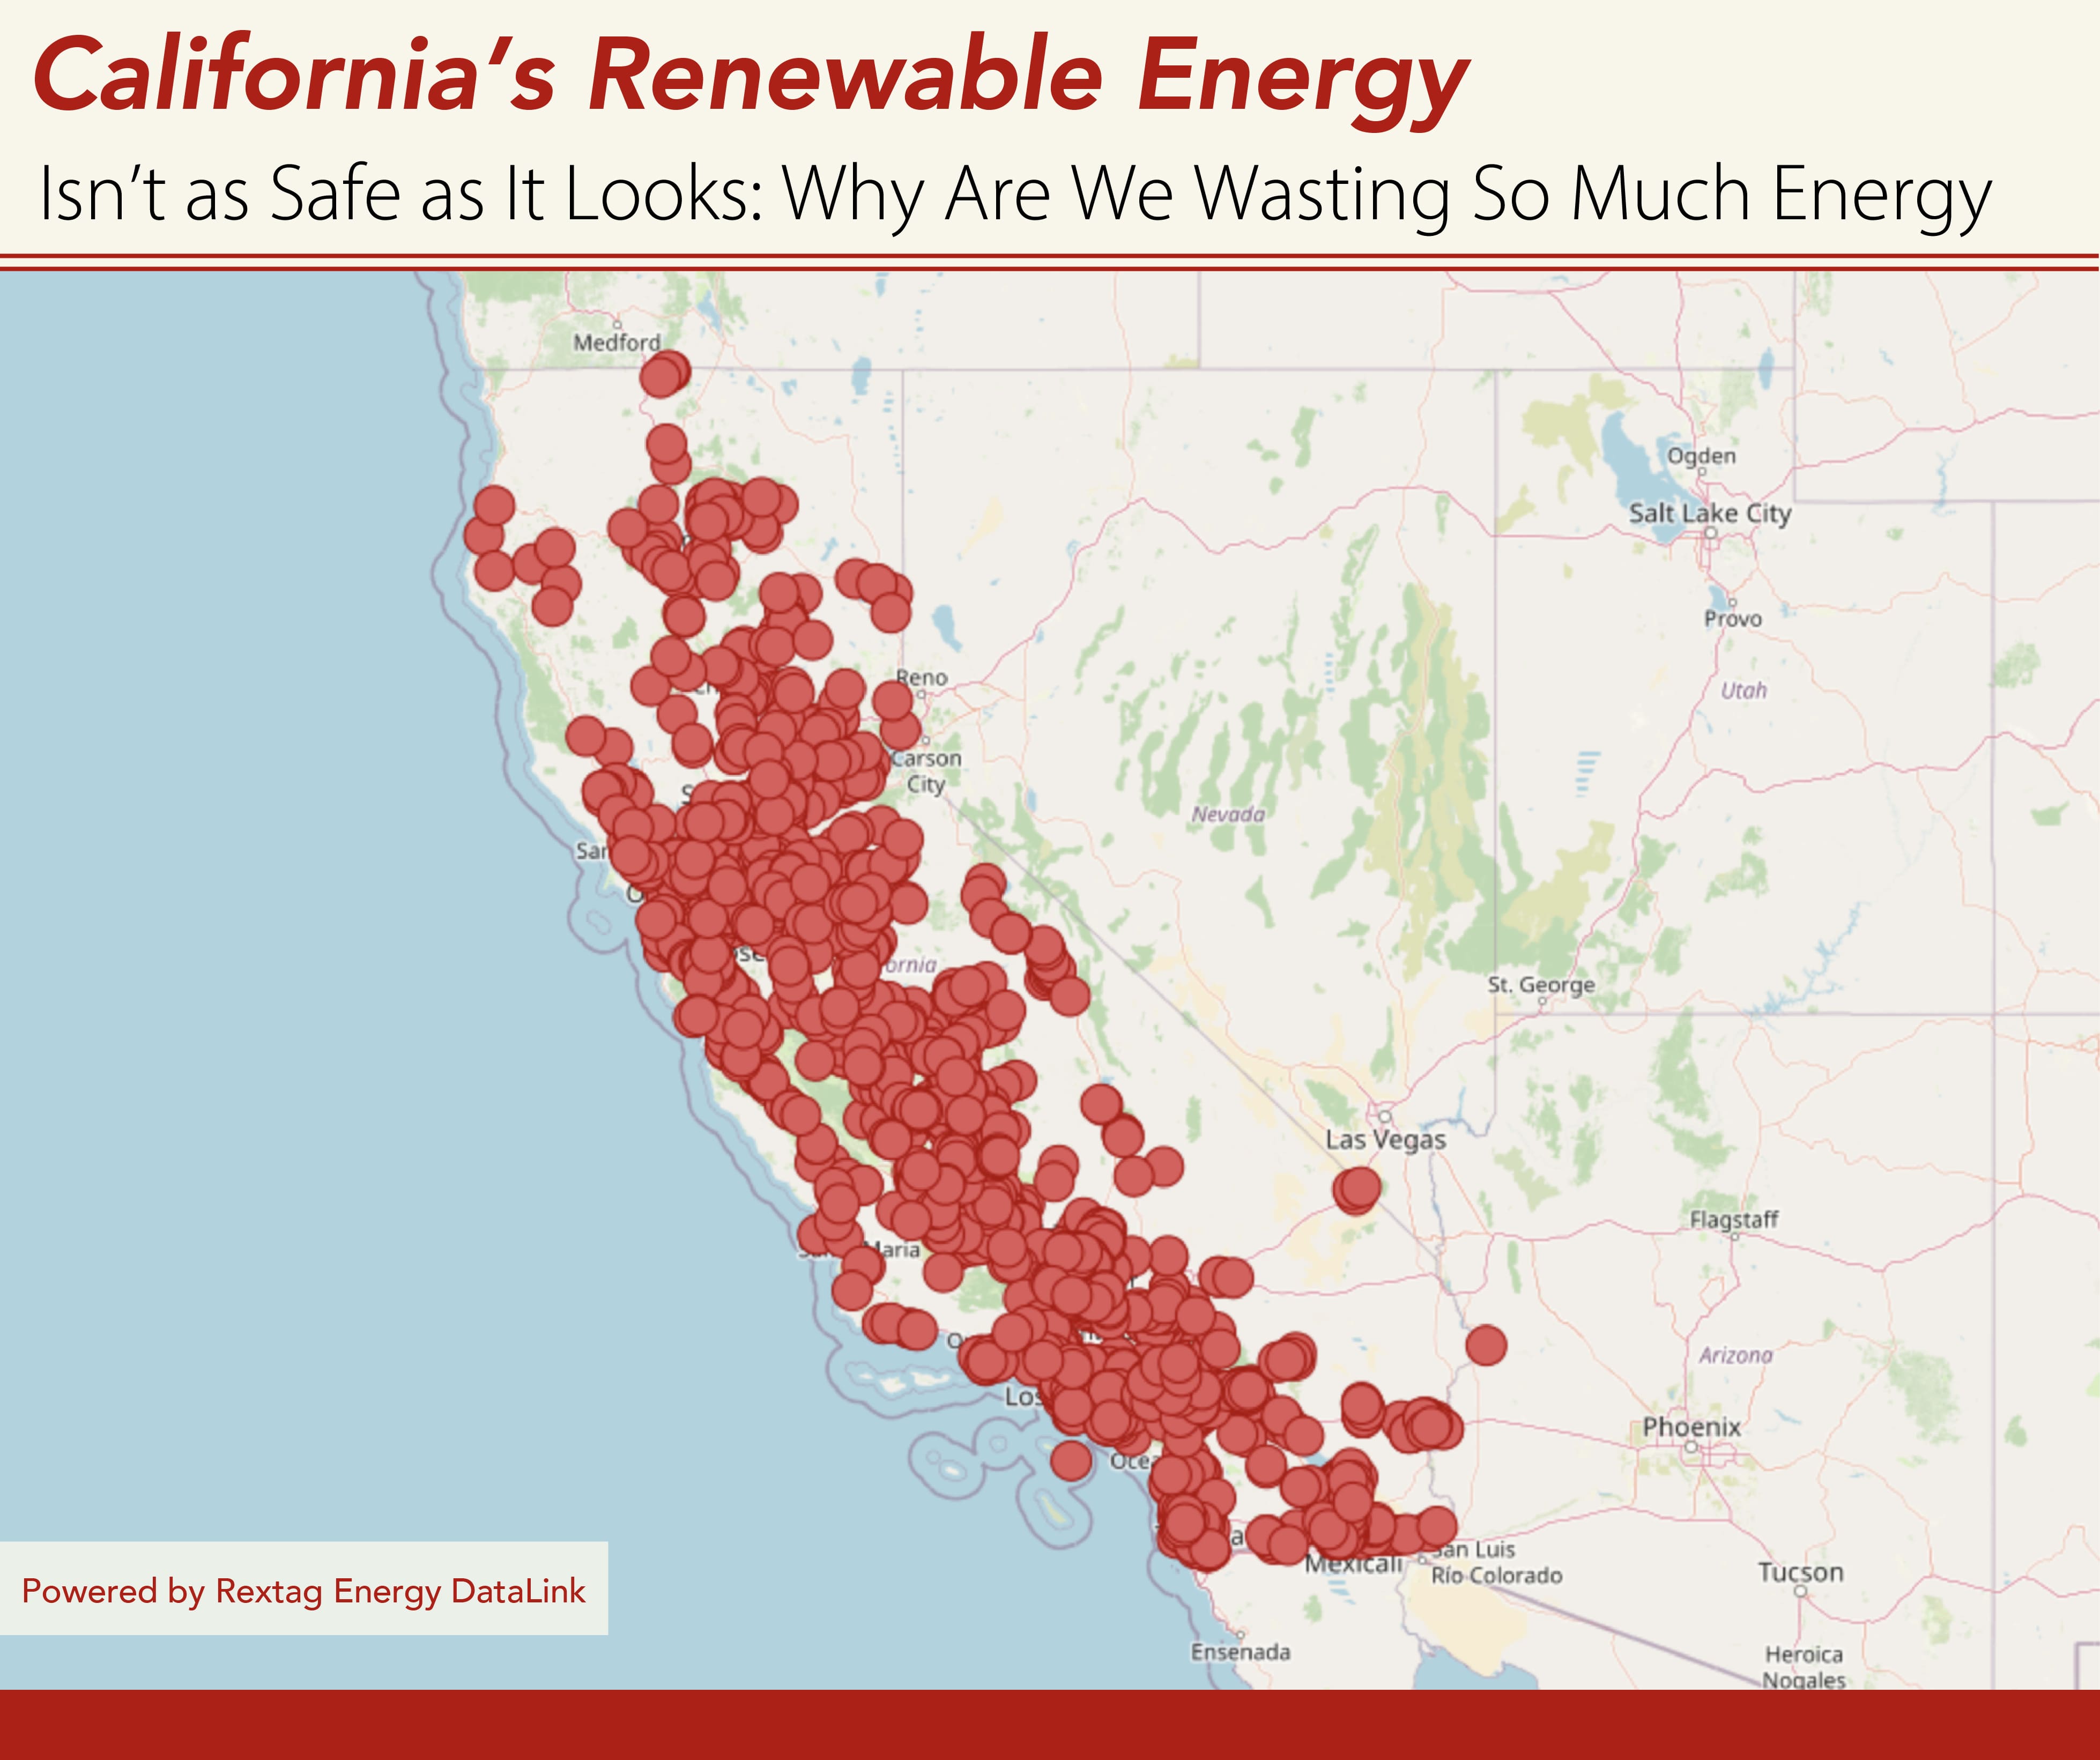
California has long been at the forefront of renewable energy in the United States, from its vast solar farms to its growing battery storage capacities. But beneath the headlines of a "clean energy revolution" lies a complex reality—one shaped by ambitious targets, grid challenges, and the everyday experiences of Californians grappling with rising energy costs and increasing grid instability. As California pushes towards its 100% clean energy goal, the road is full of both promise and pitfalls.
Can Oil-Rich Texas Be a Clean Energy Titan: Sugary Sweet Attempt at Leading the Renewable Revolution
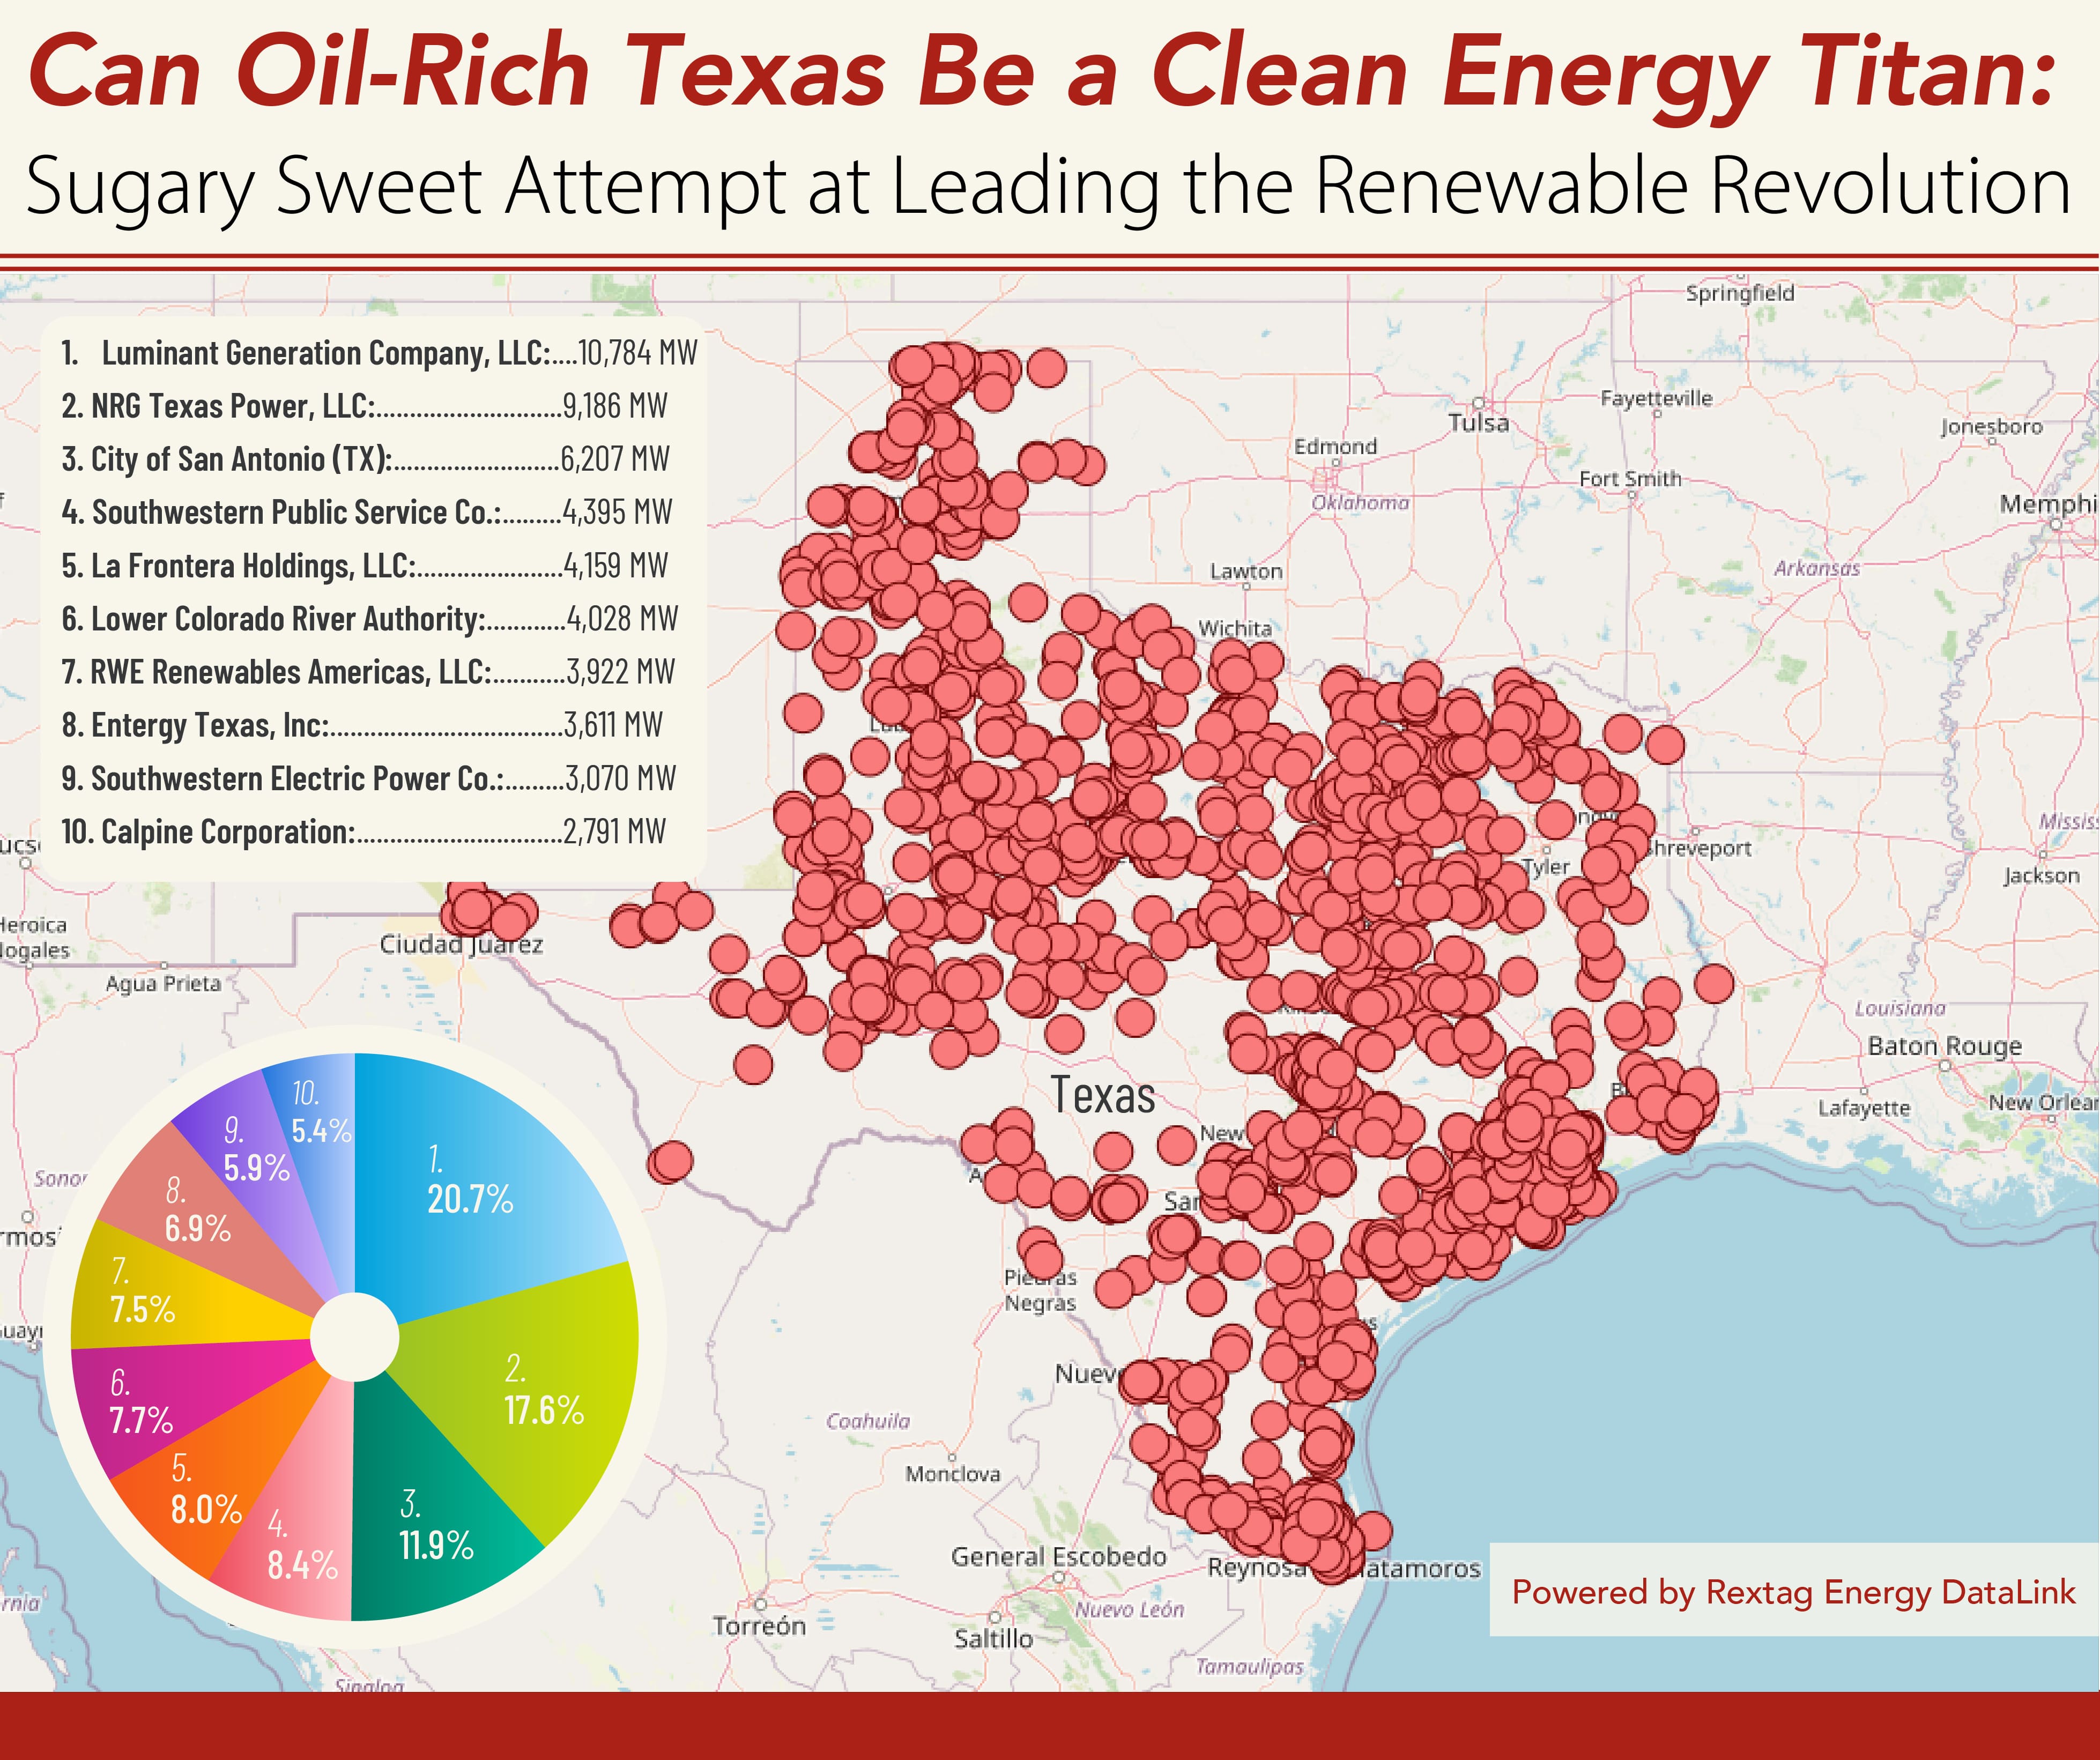
Texas is taking bold steps toward a future powered by clean energy. Once known mainly for its oil and gas, the state is now a leader in wind, solar, and battery storage. But as electricity demand grows, so do the challenges of balancing energy needs with infrastructure limits. Here’s a look at how Texas is transforming and what hurdles lie ahead + find out who works with Facebook’s parent company Meta on new technology across the U.S.
New York's Race Against Time: Can Solar and Wind Power Save the Big Apple from an Energy Crisis?
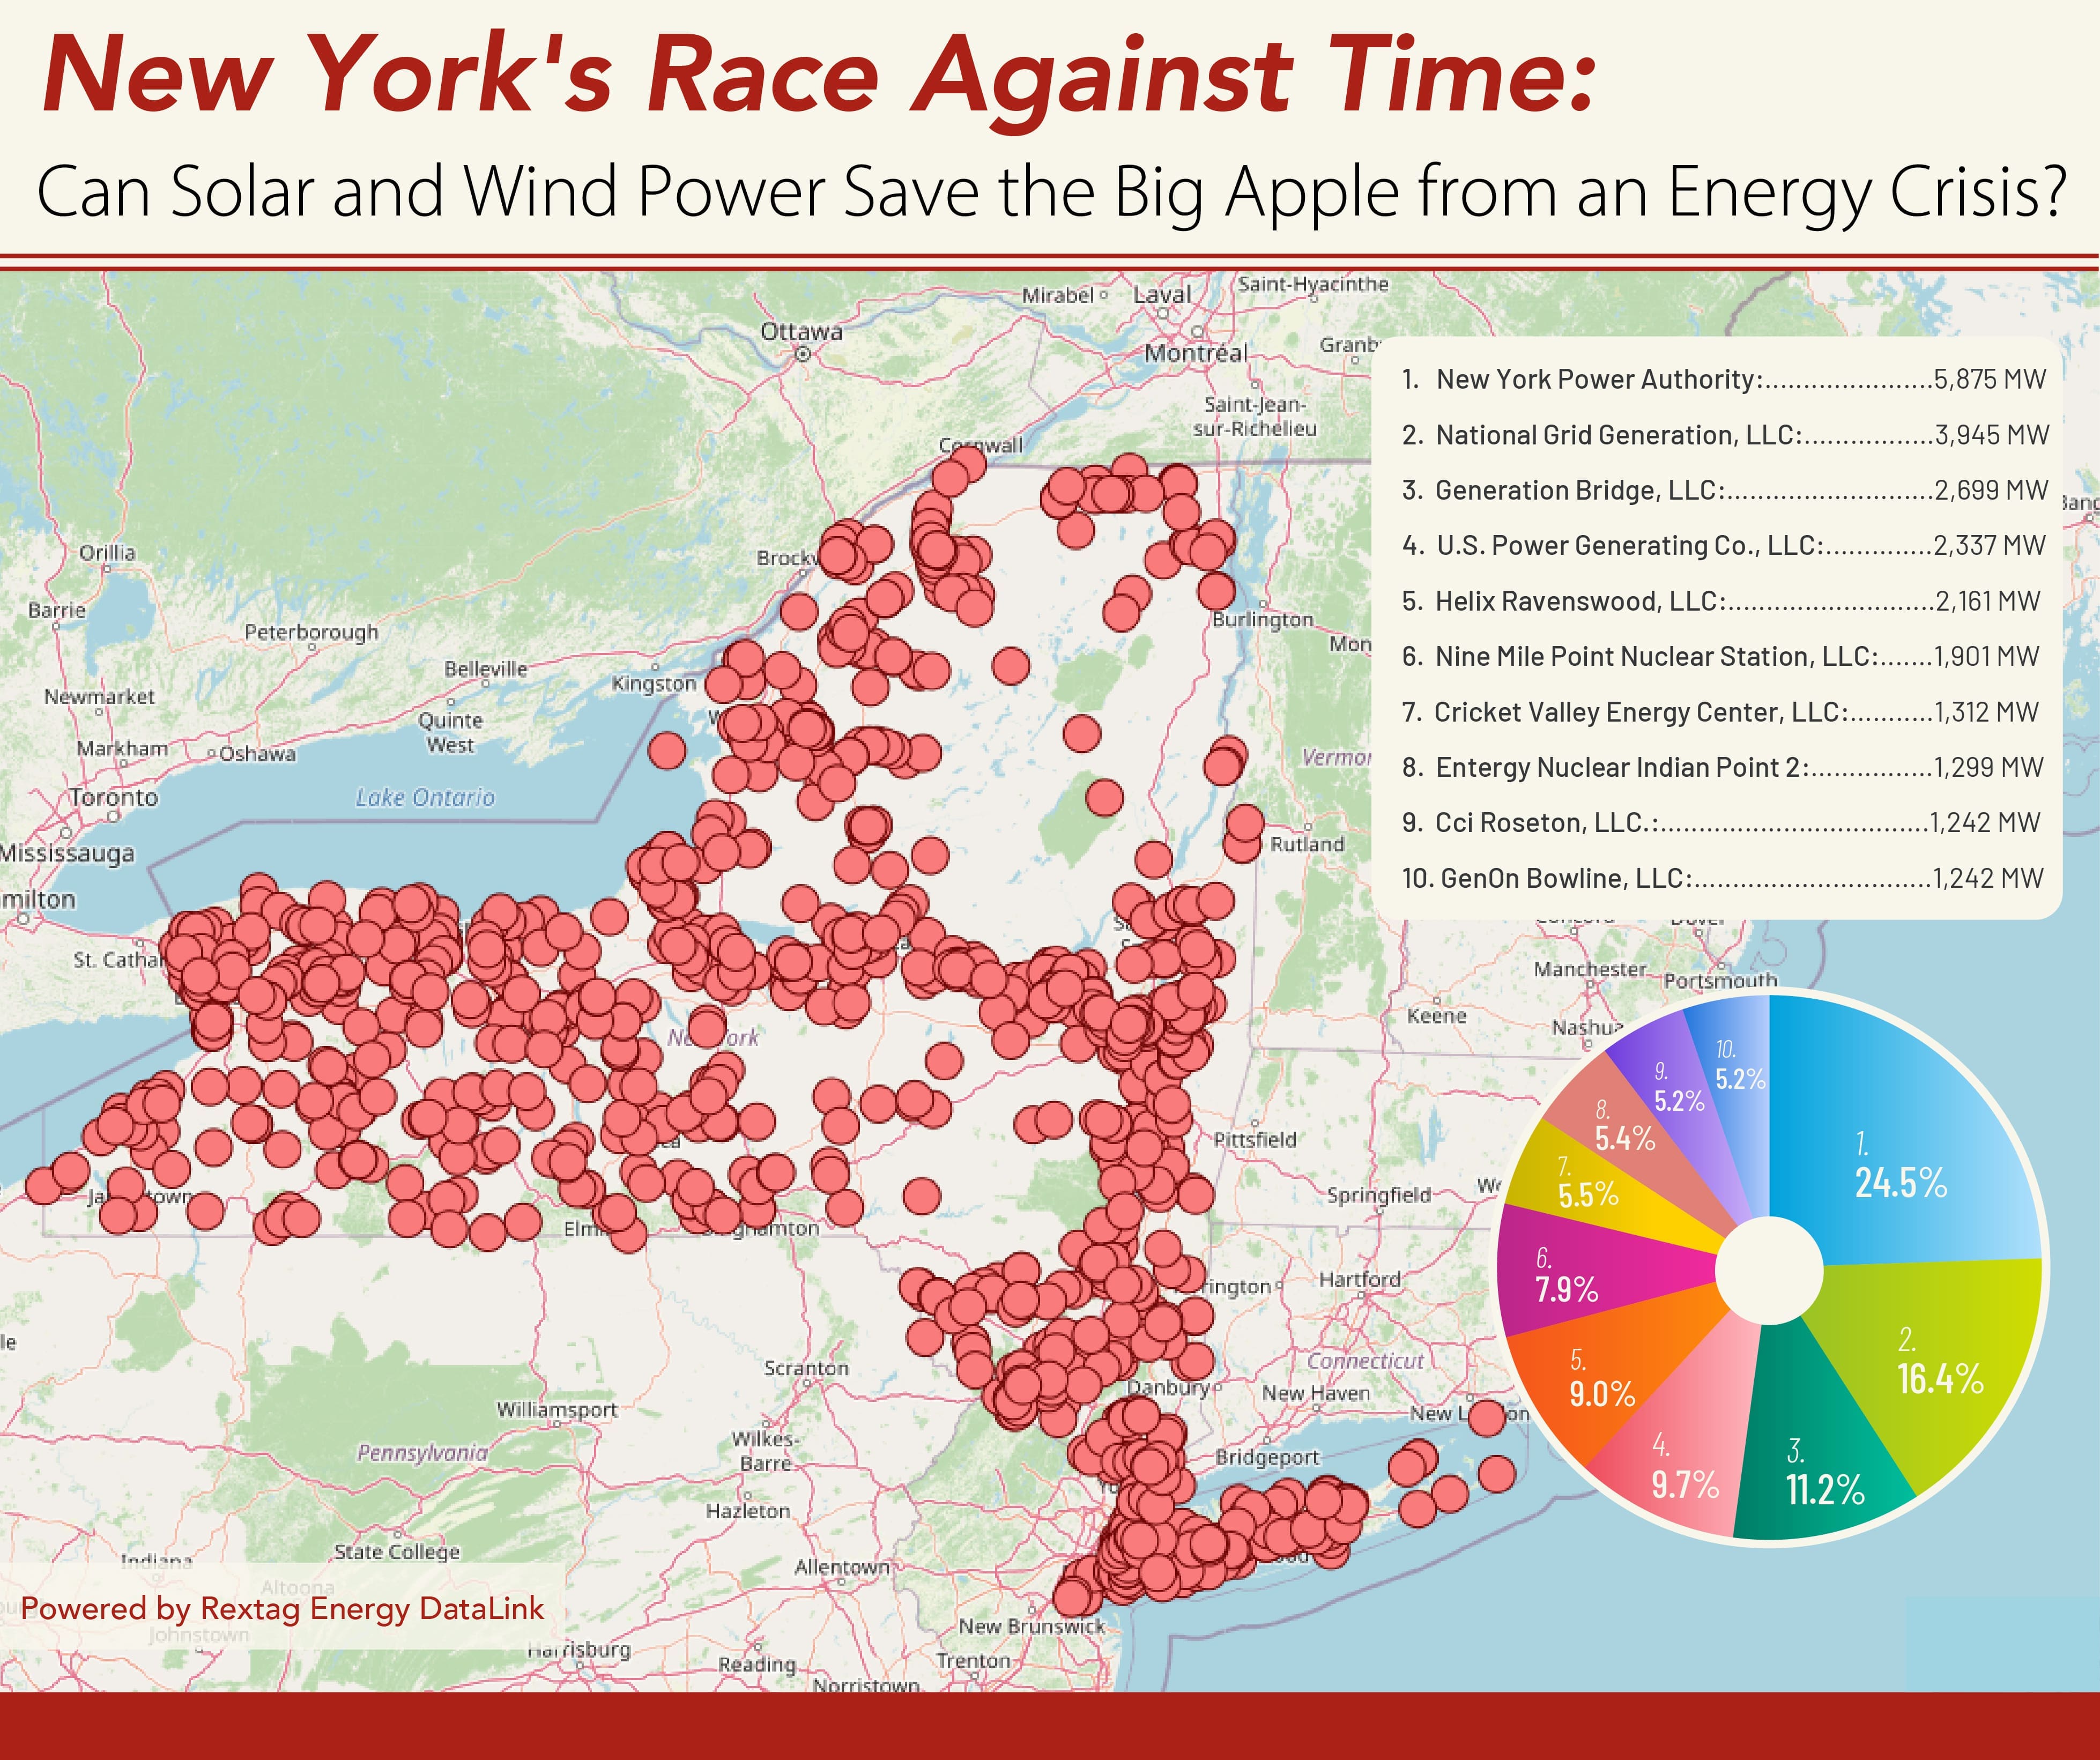
Power Plants: 124955 MW Solar: 63726 MW Wind: 2204 MW Biodisel Plants: 1.5 Mmgal/yr capacity Source: Rextag Energy DataLink
New ERA: U.S. Allocates $7.3 Billion for Rural Clean Energy Initiatives
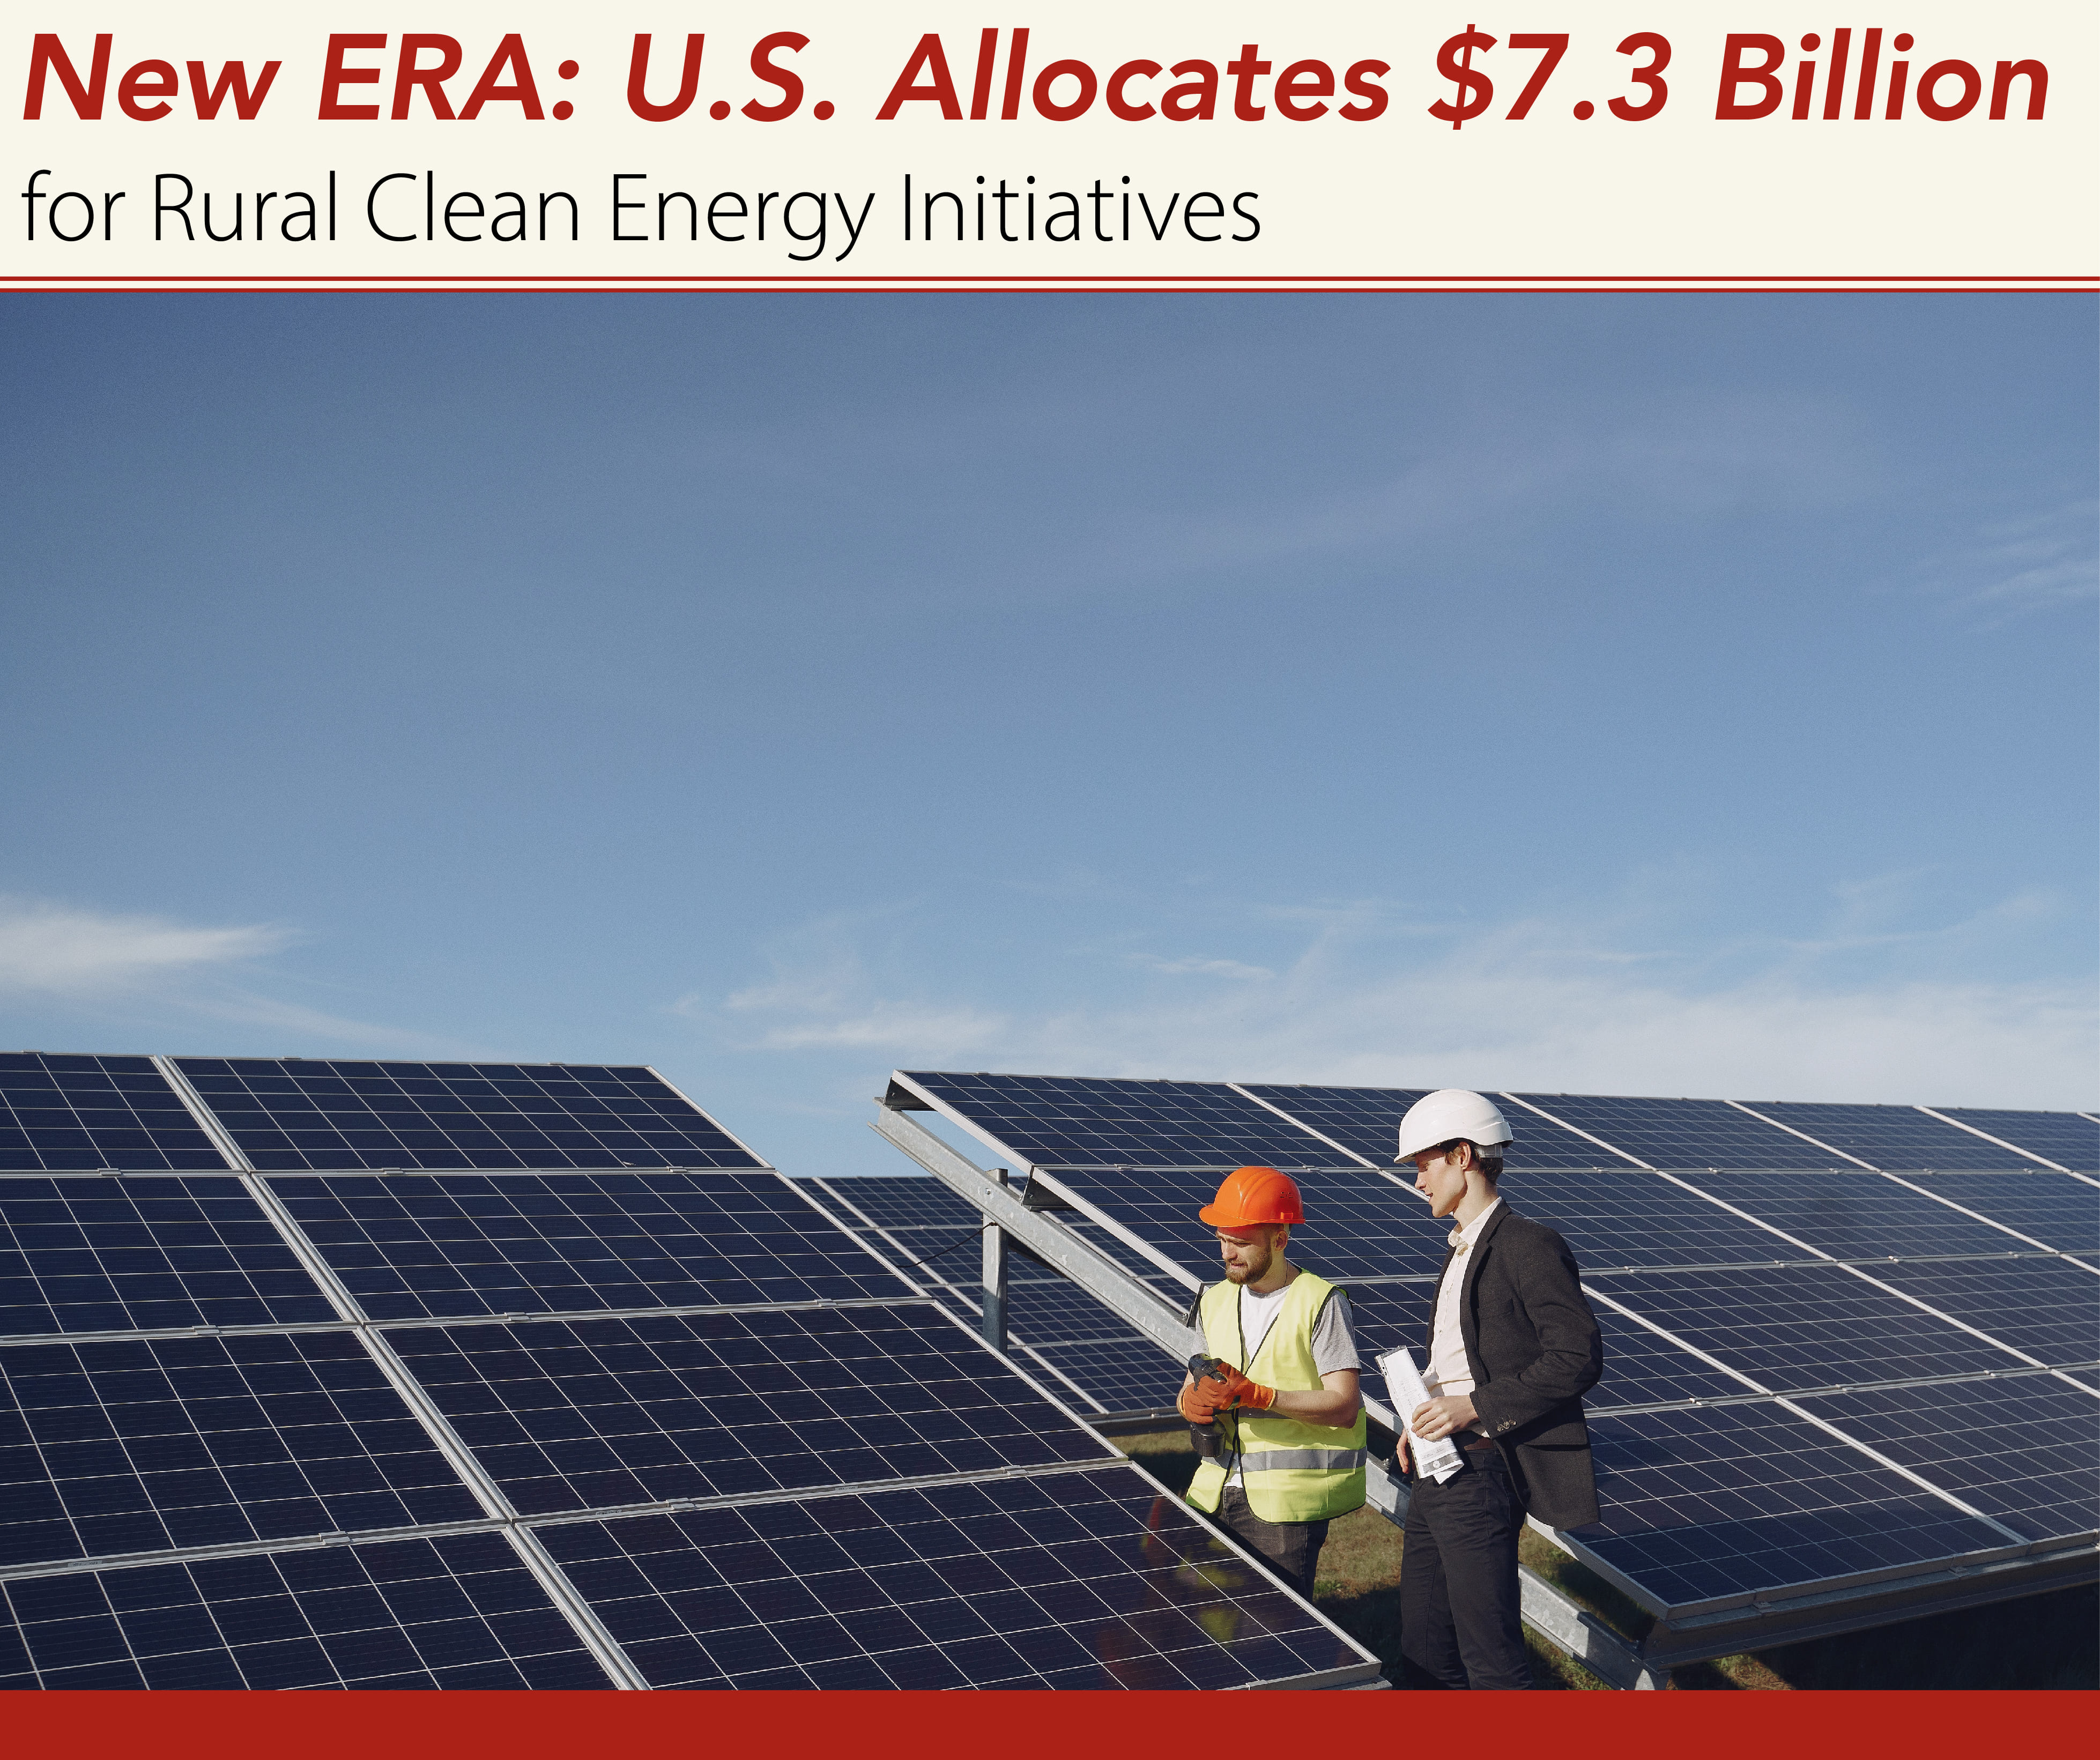
The United States government has announced a significant investment of $7.3 billion from the 2022 Inflation Reduction Act (IRA) to support clean energy initiatives led by rural electric cooperatives. These projects aim to reduce energy costs, enhance reliability, and promote sustainability for rural communities, where energy costs tend to be higher than in urban areas. This investment marks a substantial effort toward decarbonizing rural America while supporting job creation and infrastructure improvements.
Geodata Requirements for Solar Farm Siting: TOP US States for Solar Energy
.jpg)
Solar energy is quickly becoming one of the most popular and sustainable ways to generate power. As more people and businesses turn to renewable energy, finding the best spots in the United States to build solar farms is crucial. This is where Geographic Information Systems (GIS) comes in. GIS technology helps us analyze the environment, land features, and land use to identify the best places for solar energy projects. By using GIS, we can boost energy production and reduce the environmental impact, all while helping the country meet its renewable energy goals.
TOP 3 Must-Watch Trends in Oil & Gas: Exxon Mobil, Shell, BP and ConocoPhillips

Last week, Exxon Mobil, Shell, BP, and ConocoPhillips all reported second-quarter earnings that exceeded analysts' expectations, while Chevron’s results fell short, largely due to challenges in its refining business. A significant portion of these multi-billion dollar earnings came from oil and gas production. The companies' executives have indicated that they plan to increase spending on new exploration projects moving forward. While this doesn't suggest that investors are ignoring climate goals at these major oil firms, it does show that they are focusing more on the profits generated from production.
Renewable Energy and Decarbonization: From Renewable Diesel to Electrofuel, Biofuel and Geothermal Power
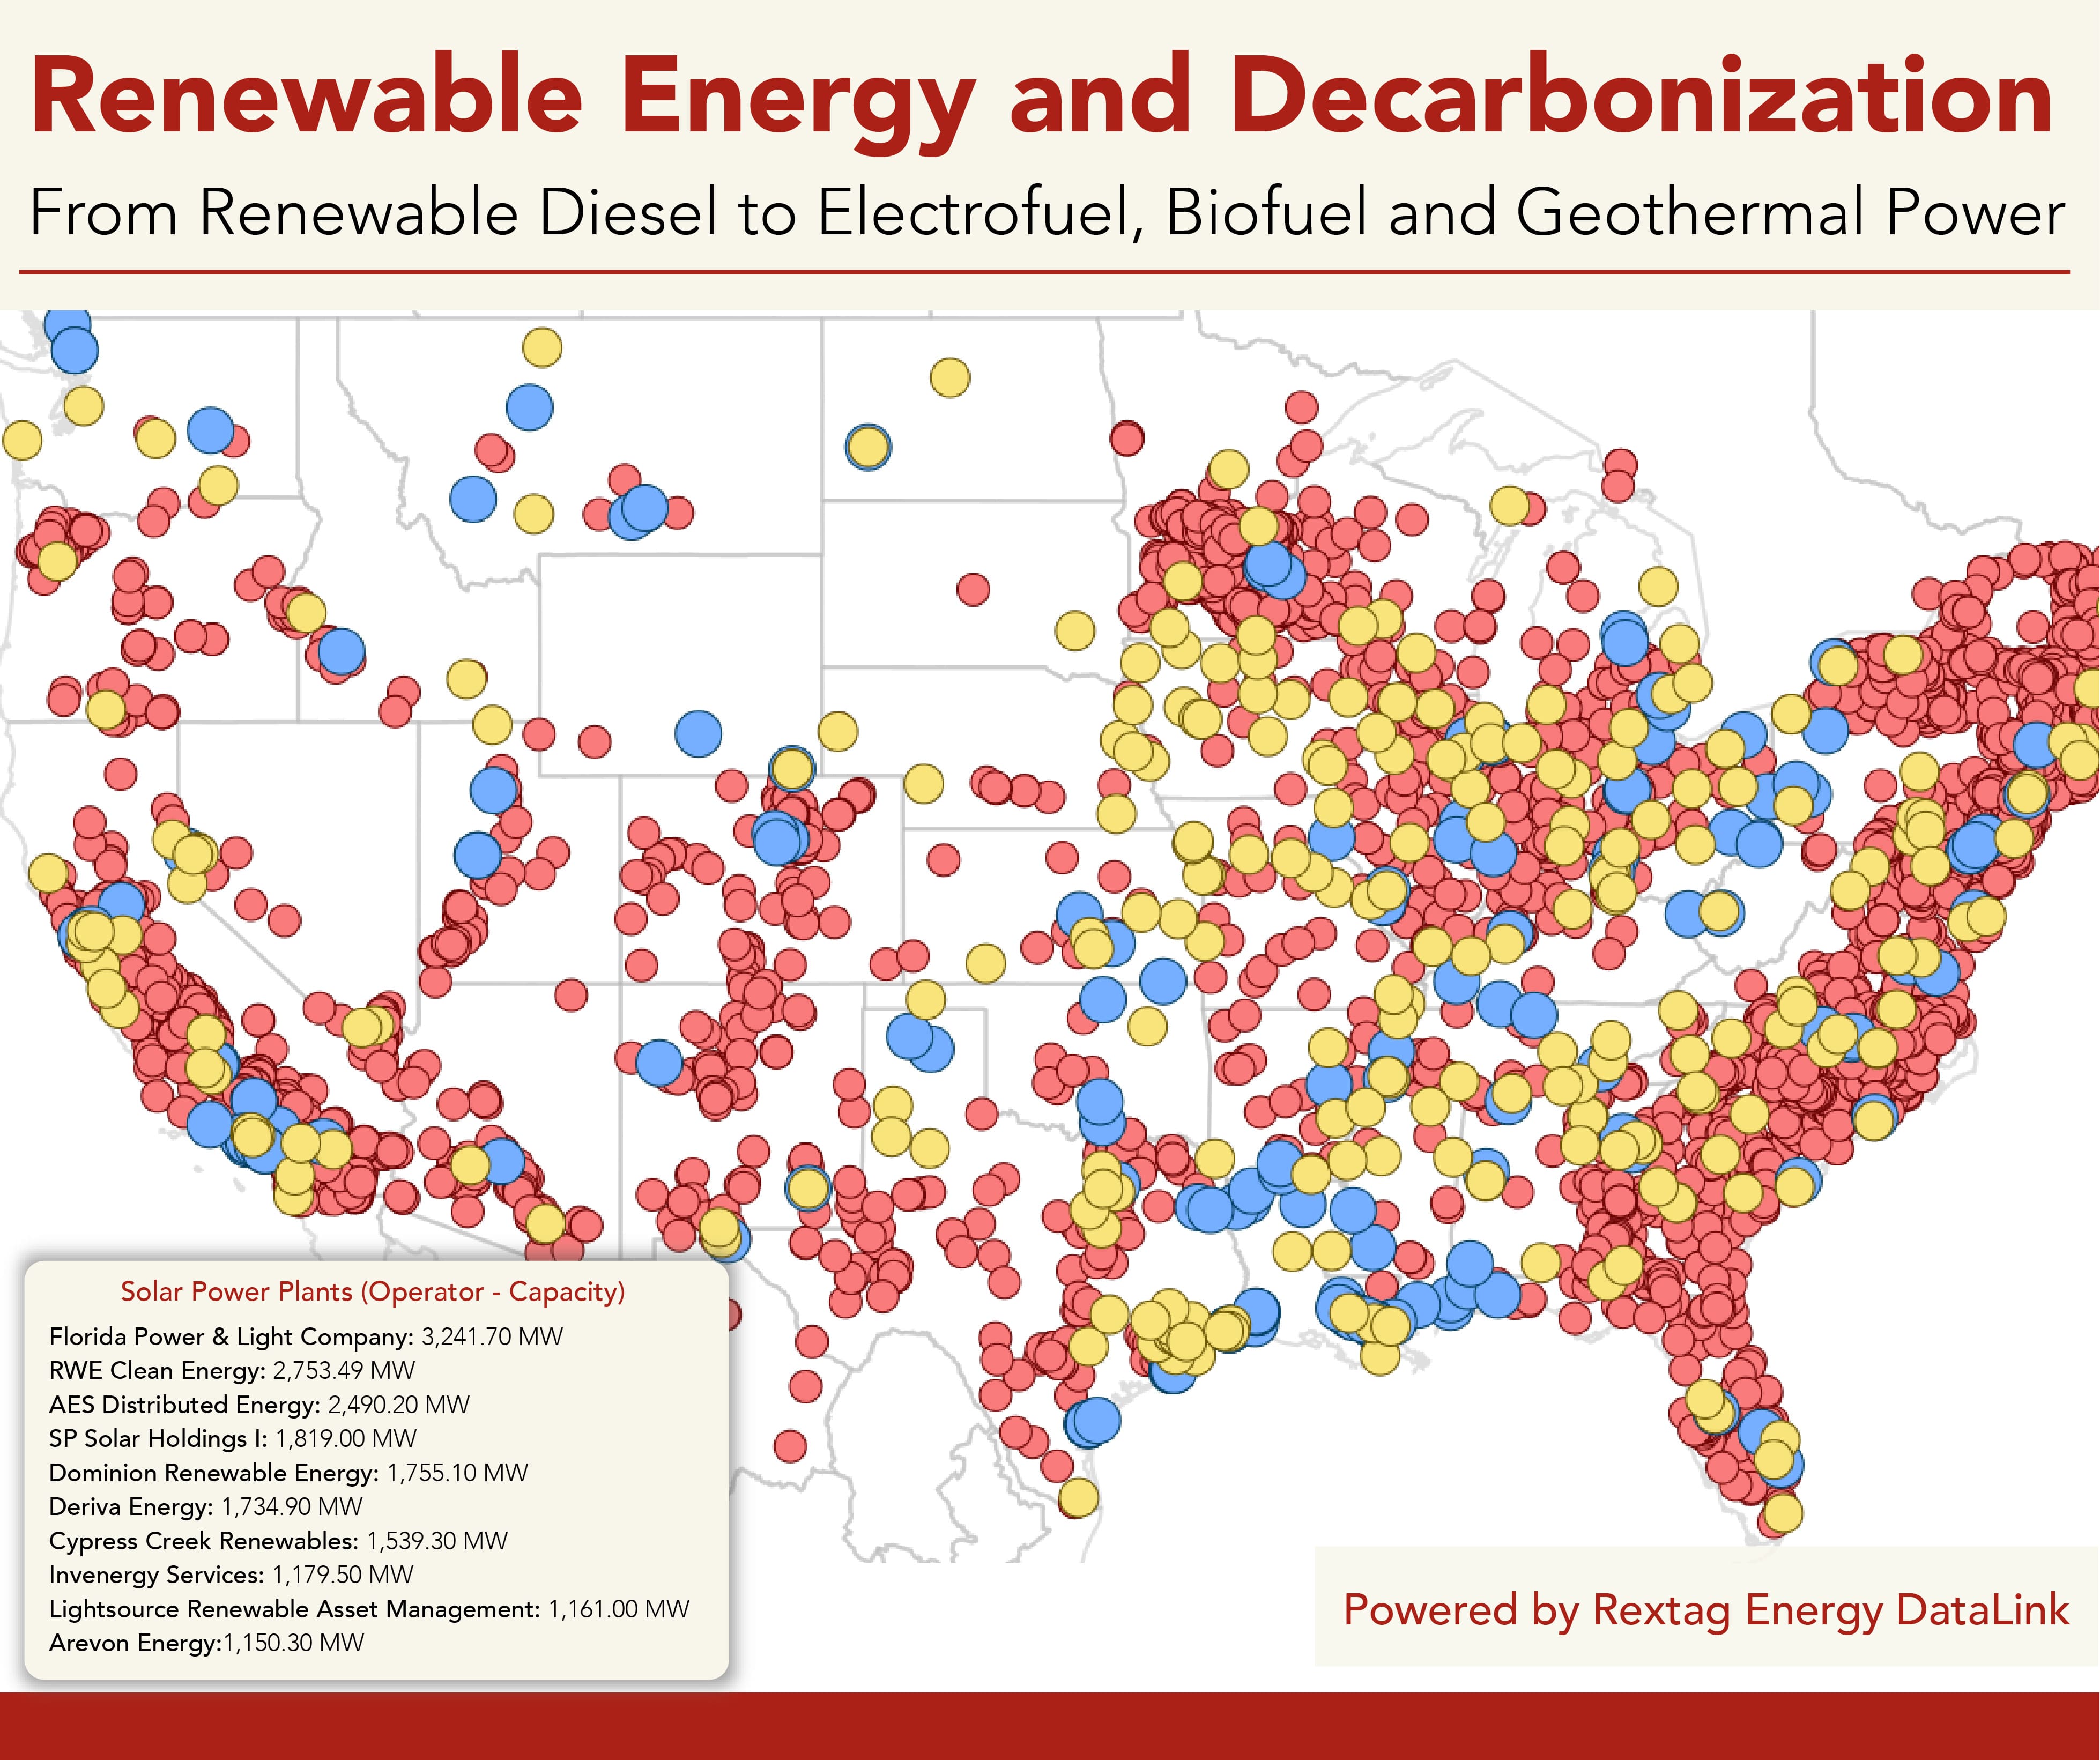
Renewable diesel, a cousin to traditional petroleum diesel, stands out as a standalone fuel and a blendable option. In 2022, it accounted for about 8% of all U.S. biofuel production and 9% of its consumption. For decades, diesel has been the stalwart choice for both shippers and carriers, valued for its reliability. Yet, as sustainability becomes a priority, these industries are now navigating the complex world of alternative fuels. This shift has its challenges; the array of choices comes with varying information about availability, cost, performance, and environmental impact. Amidst these options, renewable diesel is gaining traction.
A Green Future: $2 Trillion Investment in Clean Energy on the Horizon for 2024
The global investment in upstream oil and gas is also set to rise by 7% in 2024 to $570 billion, continuing the growth trend from 2023. National oil companies in the Middle East and Asia primarily drive this increase. This year, the global shift toward clean energy will see investments reaching a monumental $2 trillion, according to the International Energy Agency (IEA). This amount is double what is being invested in fossil fuels. In its annual World Energy Investment report, the IEA highlights that for the first time, total energy investment will surpass $3 trillion in 2024.
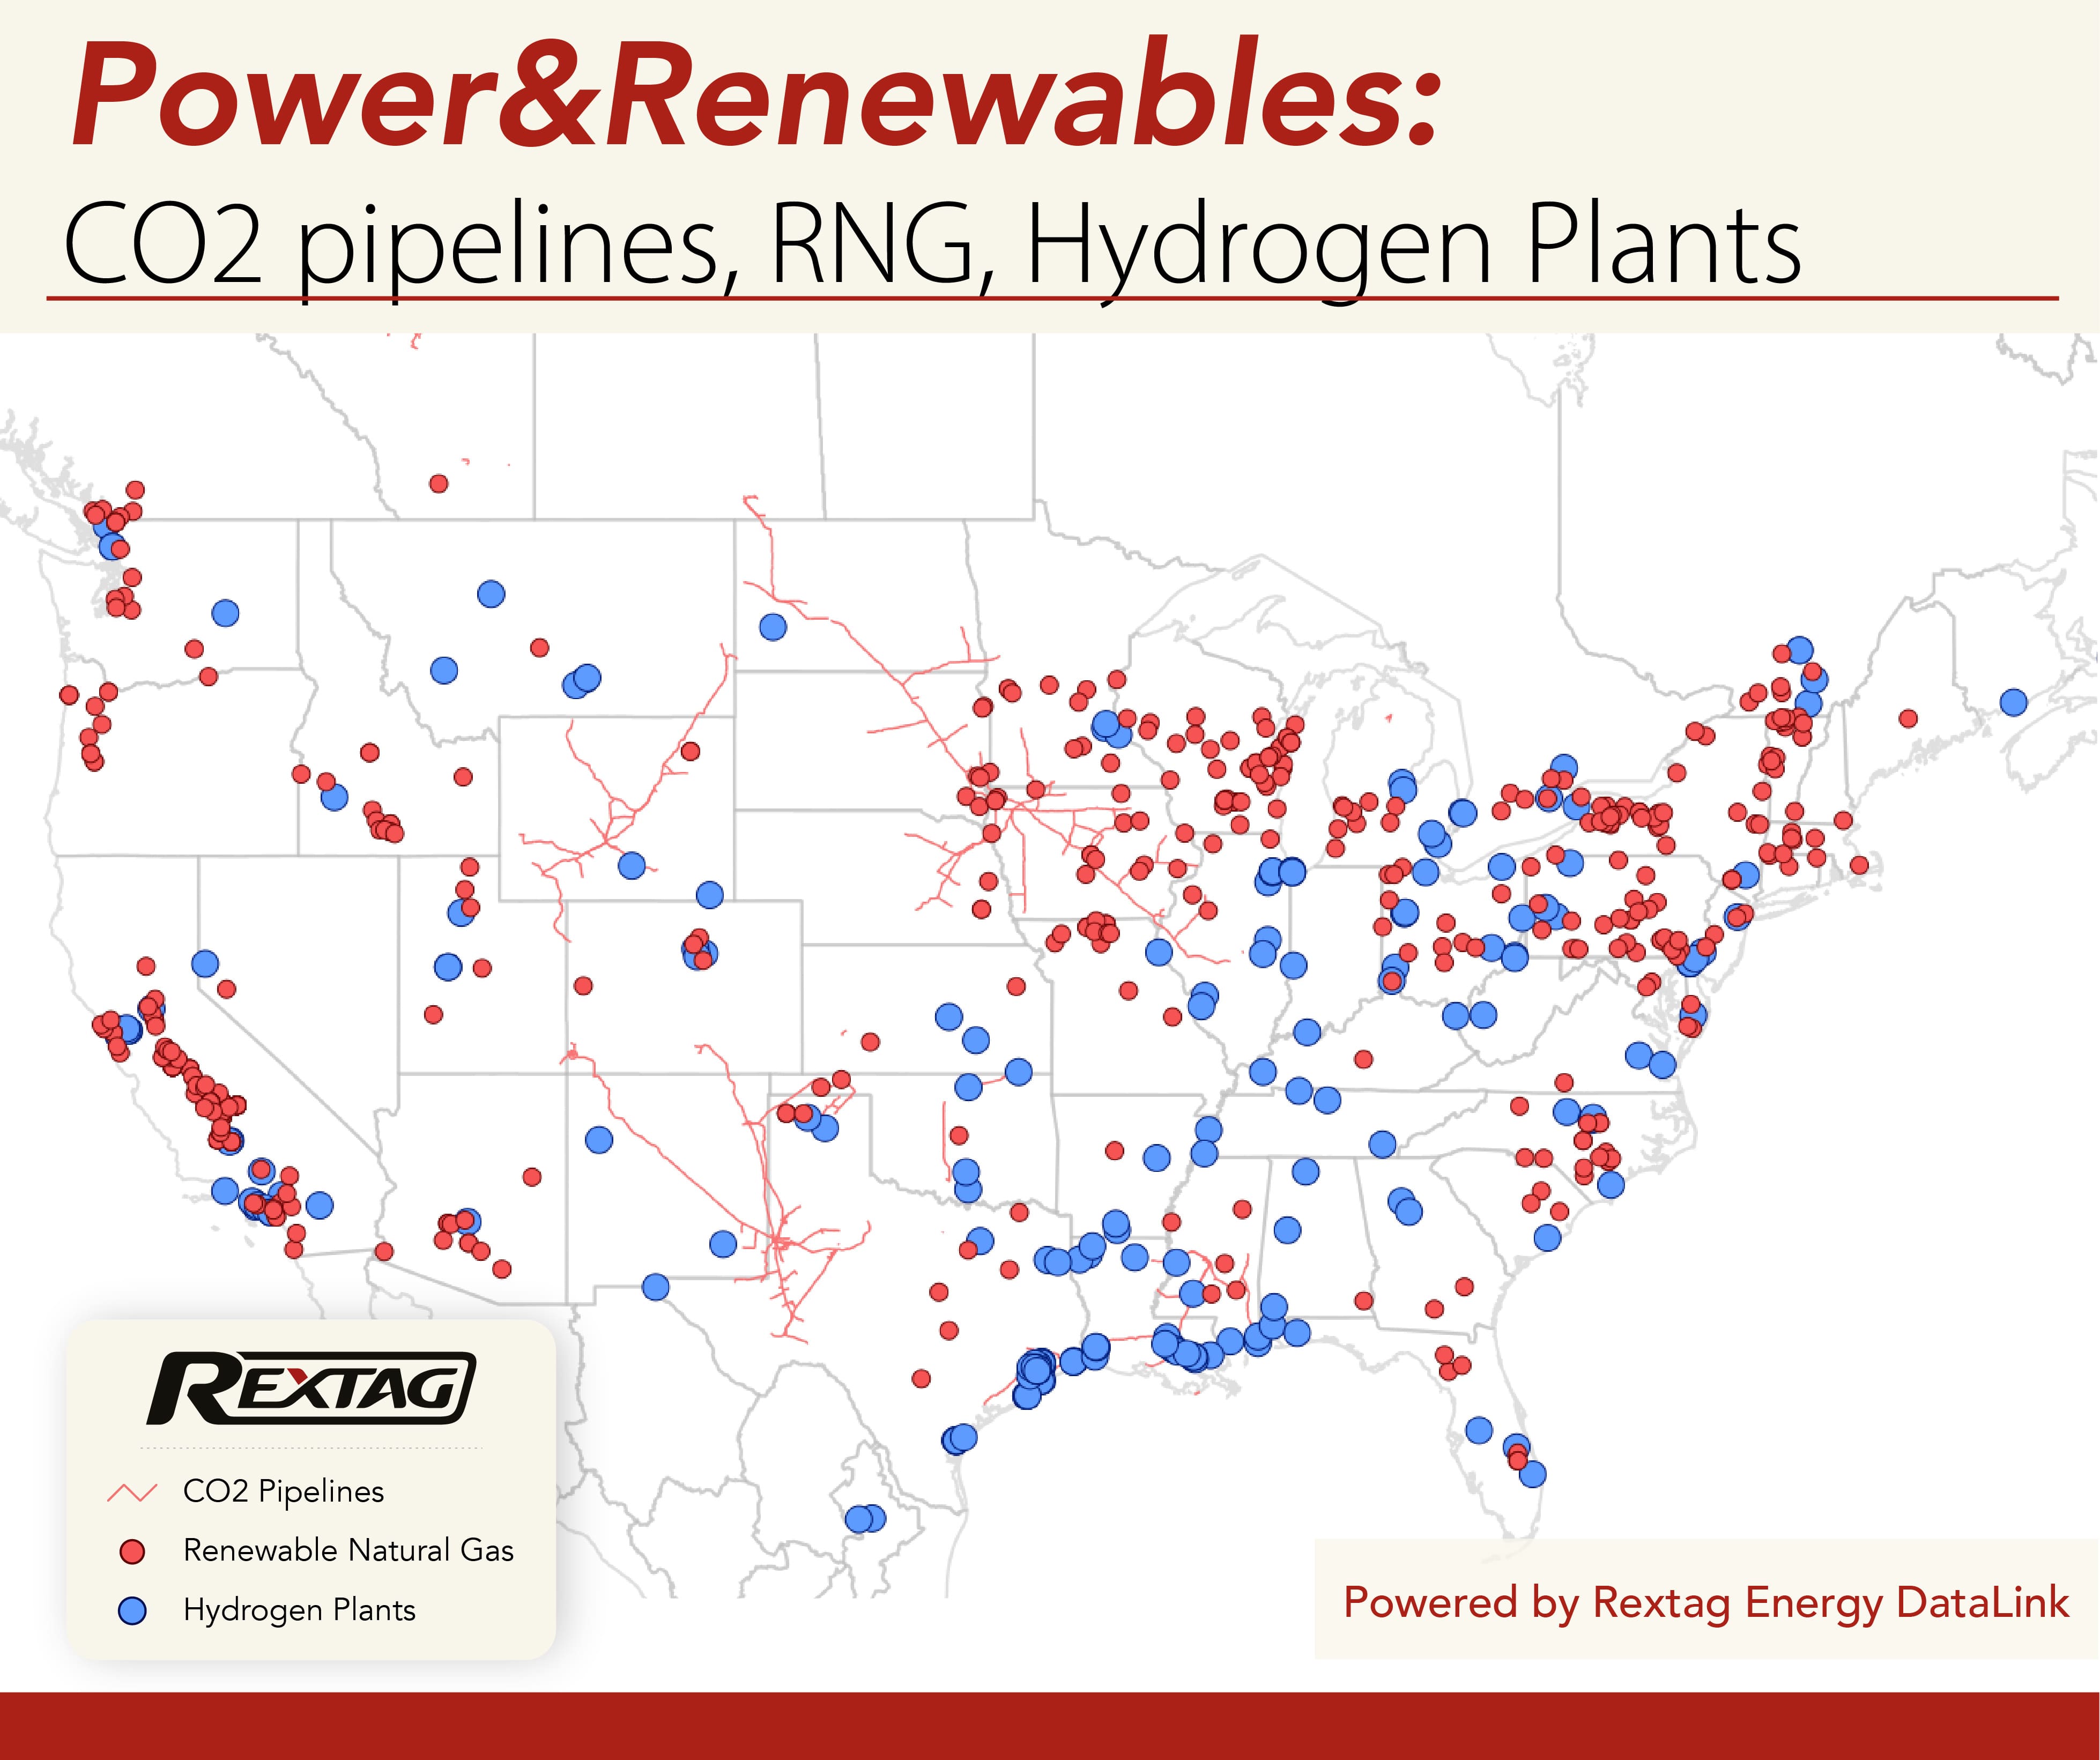
Renewable Natural Gas: How RNG Changes the Industry
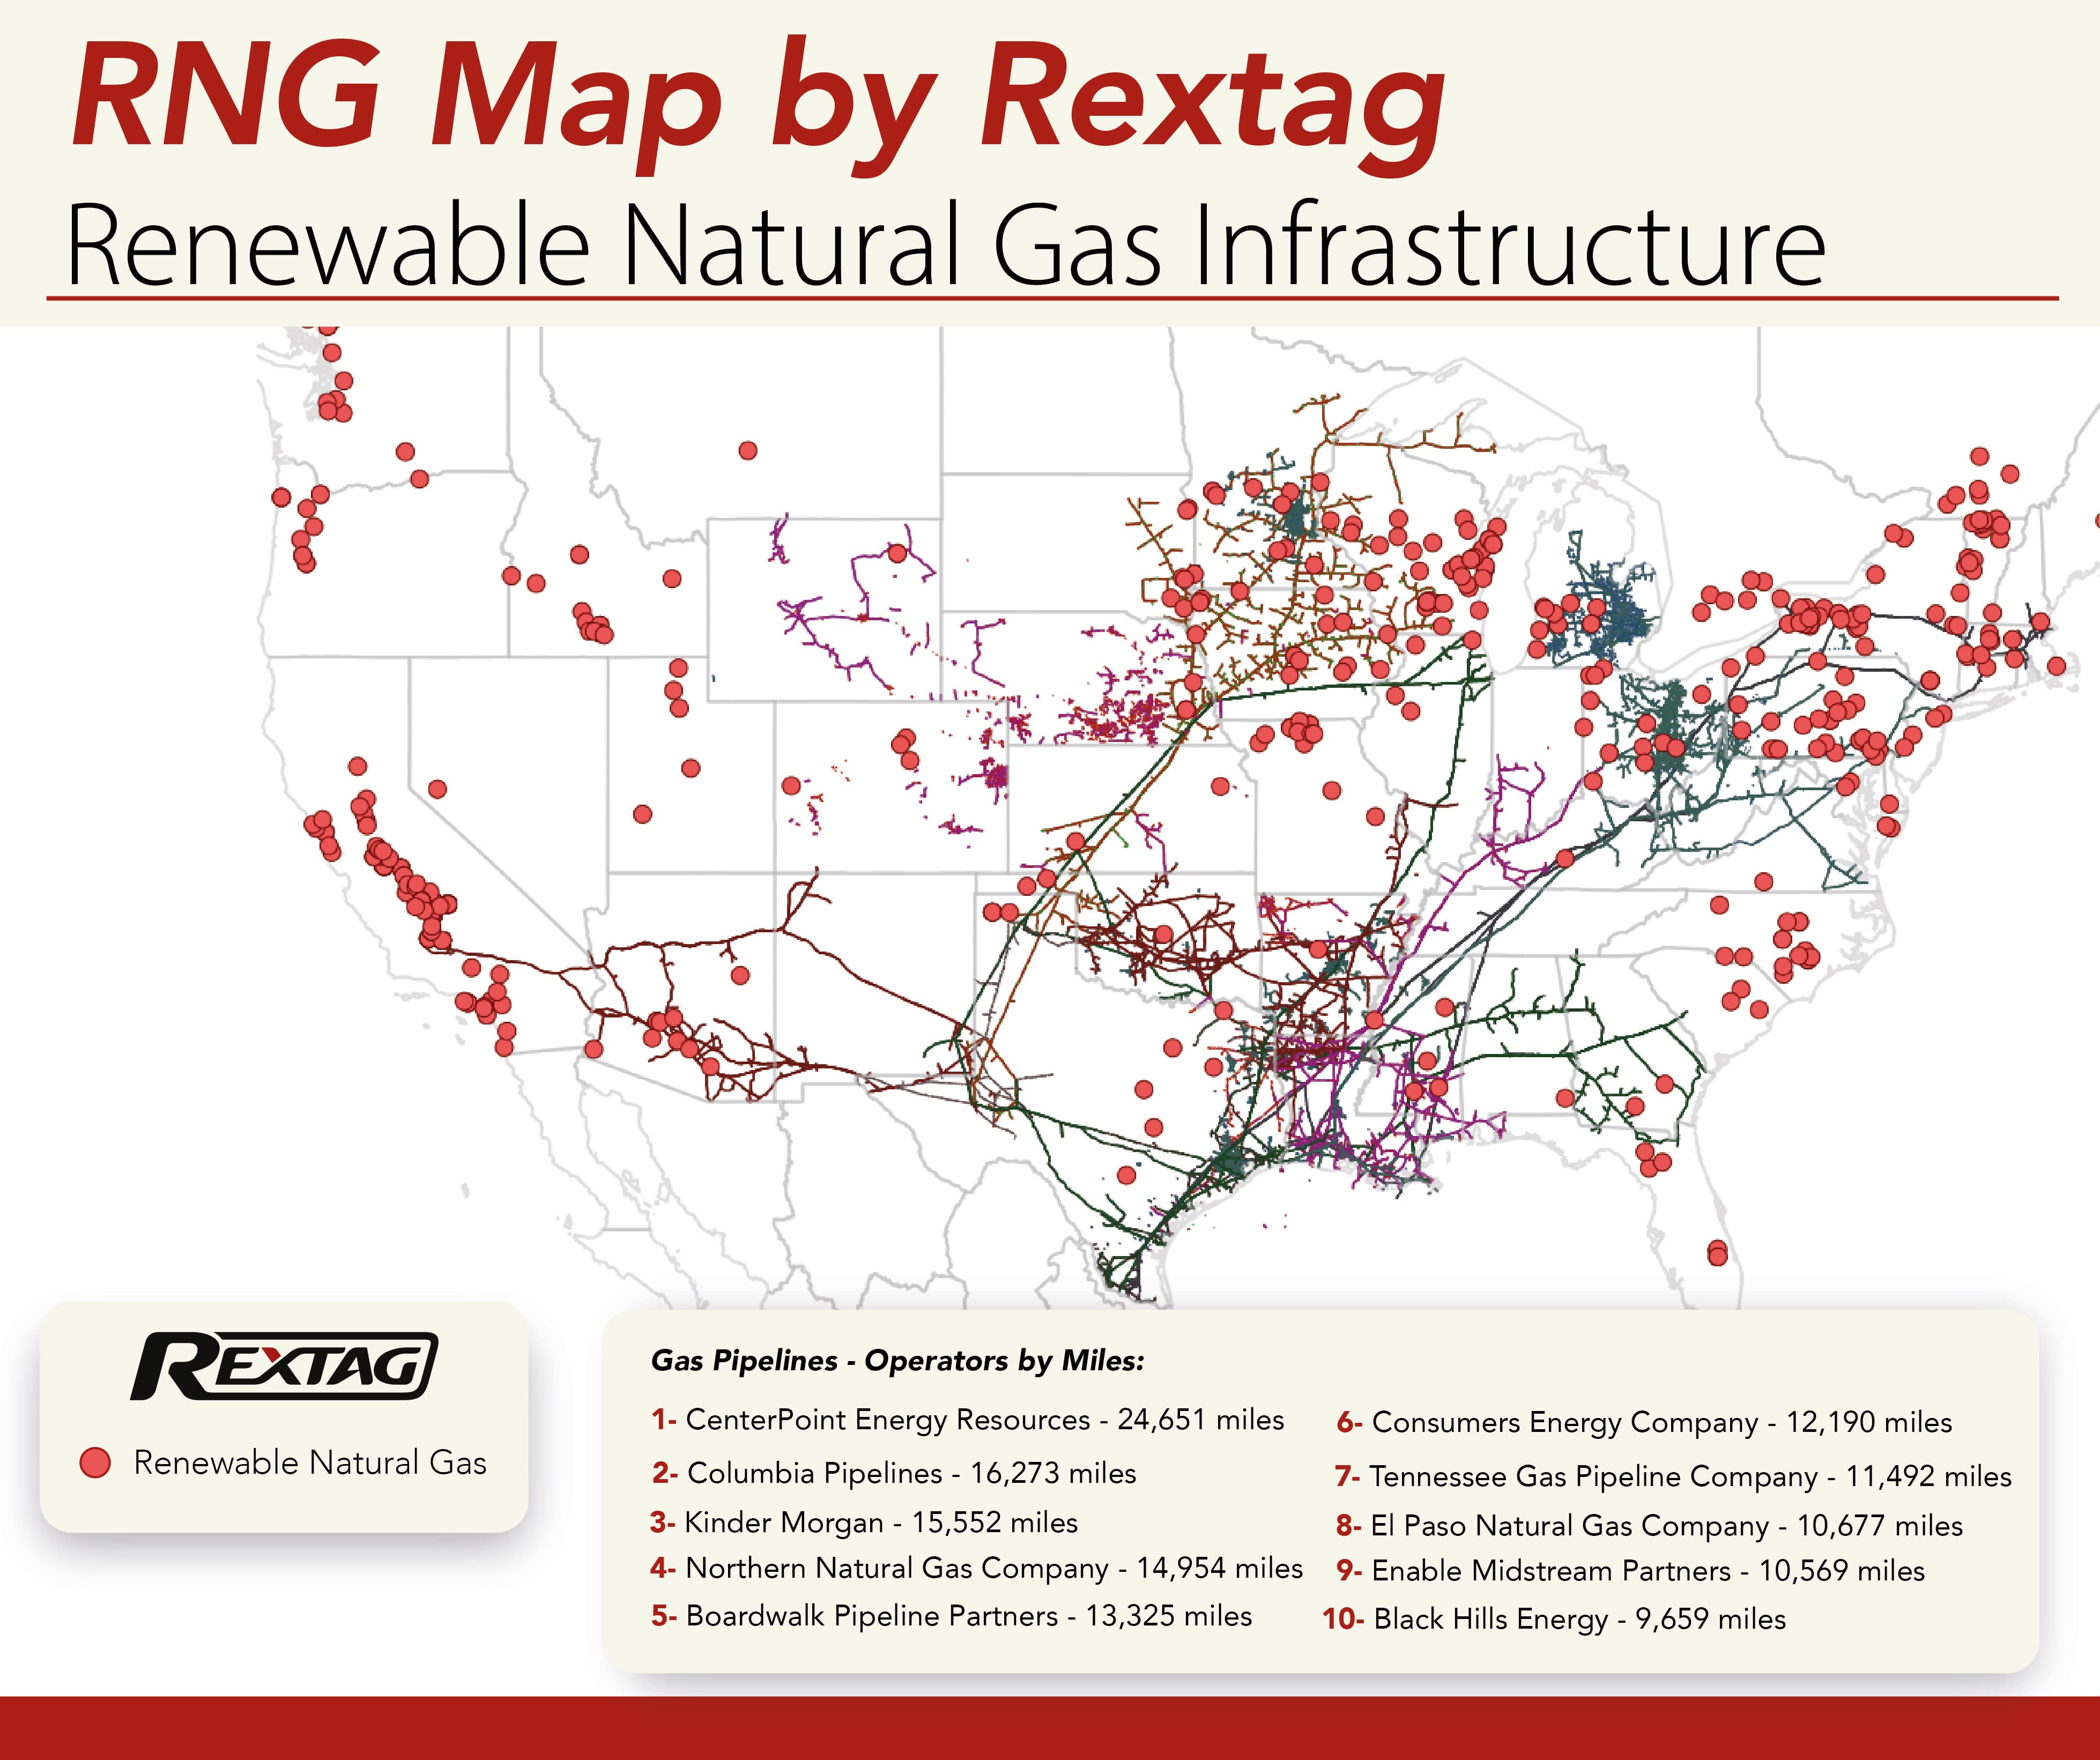
Power companies argue that natural gas is essential for meeting energy demands when renewable sources like wind and solar aren't producing enough electricity. Despite the increasing role of renewables, which are setting new records in U.S. power generation and are favored to replace coal, the intermittency of these sources presents challenges that could keep natural gas in the mix through at least 2030. According to the U.S. Energy Information Association, the U.S. has enough natural gas reserves to last approximately 86 years. However, the finite nature of these reserves highlights the need for a continued shift towards more renewable and sustainable energy sources.
Cold Weather Disruptions Lead to Lower US Natural Gas Production in January 2024
.png)
In January, US natural gas production dropped to 102 billion cubic feet per day (Bcf/d) from December's record of 106 Bcf/d due to bad weather. The Energy Information Administration (EIA) expects it to recover soon, hitting 105 Bcf/d by March. The EIA's outlook for 2024 predicts an average production of about 104 Bcf/d, slightly down from the earlier forecast of 105 Bcf/d. By 2025, production is anticipated to climb over 106 Bcf/d.