Comprehensive Energy Data Intelligence
Information About Energy Companies, Their Assets, Market Deals, Industry Documents and More...
Renewable Energy and Decarbonization: From Renewable Diesel to Electrofuel, Biofuel and Geothermal Power
07/02/2024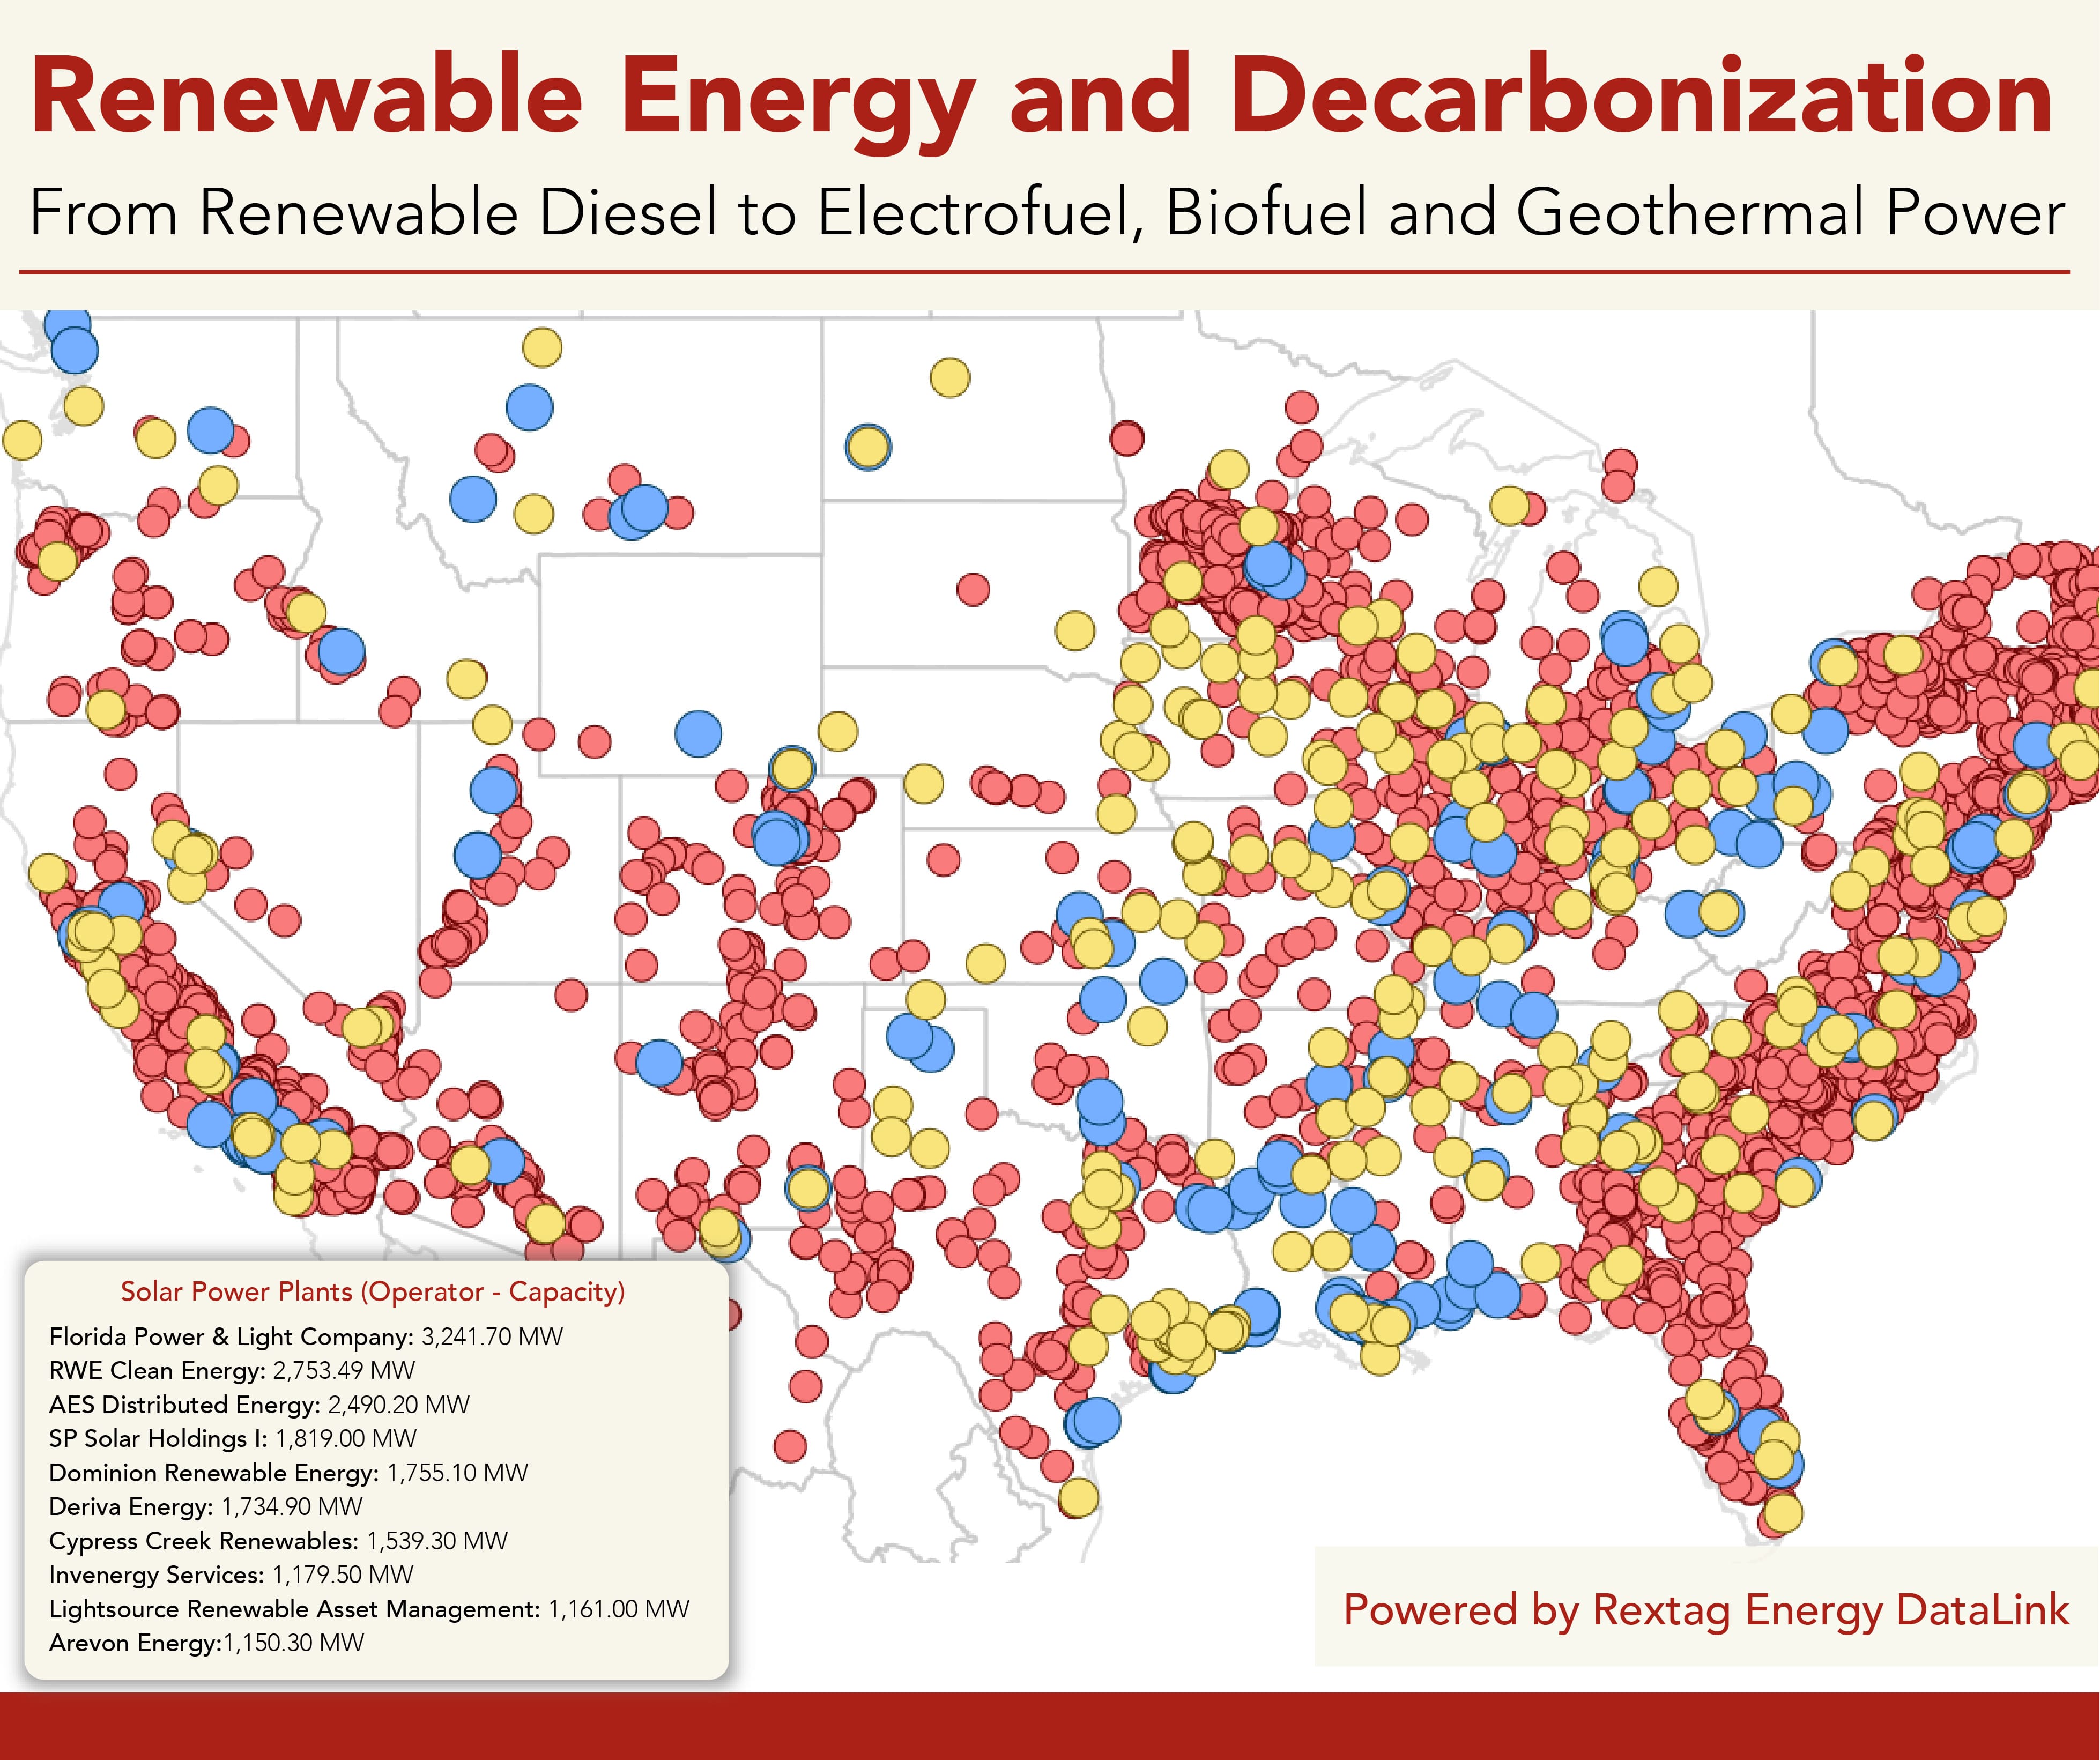
- U.S. renewable diesel production capacity nearly quadrupled from 791 million gallons in 2021 to 3 billion gallons by 2023.
- This increase was part of refiners' strategies to transition away from petroleum-based products.
- By 2023, combined U.S. output capacity for renewable diesel and biodiesel surpassed 5 billion gallons.
- Despite the increased capacity, the U.S. EPA's Renewable Fuel Standards (RFS) program set blending targets for biomass-based diesel at up to 4.5 billion gallons annually through 2025.
Renewable diesel, a cousin to traditional petroleum diesel, stands out as a standalone fuel and a blendable option. In 2022, it accounted for about 8% of all U.S. biofuel production and 9% of its consumption.
For decades, diesel has been the stalwart choice for both shippers and carriers, valued for its reliability. Yet, as sustainability becomes a priority, these industries are now navigating the complex world of alternative fuels. This shift has its challenges; the array of choices comes with varying information about availability, cost, performance, and environmental impact. Amidst these options, renewable diesel is gaining traction.
In terms of numbers for 2022, the U.S. saw a production of 1.50 billion gallons of renewable diesel, with imports at 0.26 billion gallons, culminating in a consumption of 1.72 billion gallons.
California leads the way in renewable diesel availability, boasting over 570 fueling stations. The state is the primary consumer of both imported and domestically produced renewable diesel, largely due to supportive policies like the Low Carbon Fuel Standard, which make renewable diesel economically competitive with petroleum diesel.
Environmental Benefits of Renewable Diesel
In its pure form, renewable diesel dramatically cuts greenhouse gas emissions, reducing them by about 62% in heavy-duty vehicles compared to traditional diesel. It also significantly lowers other harmful emissions, cutting particulate matter by 34%, nitrous oxides by 10%, and carbon monoxide by 12%.
Growth in Renewable Diesel Production
Between January 2022 and January 2023, the production capacity for renewable diesel and other biofuels surged by 71% in the U.S. According to the Energy Information Administration, renewable diesel capacity is expected to reach 5.9 billion gallons by the end of 2025, which would represent about 10% of the nation's annual diesel consumption.
U.S. refiners, facing an excess of renewable diesel, are expected to explore markets in Canada and Europe. Imperial Oil in Canada is advancing with plans to construct a renewable diesel plant near Edmonton with a capacity of 20,000 barrels per day, which will produce fuel more cost-effectively than importing from the U.S.
Meanwhile, Braya Renewable Fuels started production of renewable diesel in February at the Come-by-Chance refinery in Newfoundland and Labrador. However, they anticipate that operational challenges may delay further supply increases. Braya's facility produces up to 18,000 bpd of renewable diesel, which is then sold through a marketing partner.
Vertex Energy is taking a different route by planning to convert its 8,000-bpd renewable diesel facility in Alabama back to fossil fuel production. In a similar vein, Chevron in March announced the mothballing of two biodiesel plants due to unfavorable market conditions.
According to Energy Information Administration data, the U.S. imported about 900 million gallons of biodiesel and renewable diesel last year. Imports in the first two months of 2024 year were around 200 million gallons, with expectations of an increase as importers aim to maximize remaining tax credits.
Renewable Diesel and Biodiesel: What Is The Difference?
Biodiesel not only competes with renewable diesel for the same feedstocks but also generates fewer Renewable Identification Numbers (RINs), placing it at a further disadvantage amidst the surge in renewable diesel.
Renewable diesel and biodiesel are both eco-friendlier alternatives to conventional diesel, yet they are not the same. Renewable diesel is crafted from fats and oils like animal tallow and soybean oil. It undergoes a refining process that makes it chemically similar to petroleum diesel, allowing it to seamlessly integrate into current diesel engines and infrastructure without any adjustments or loss of performance.
Biodiesel, however, is derived from sources like animal fats, vegetable oils, or recycled grease. Its higher oxygen content can affect engine performance and lead to operational issues depending on the climate—mold may form in warmer conditions, while colder temperatures can cause the fuel to gel.
While renewable diesel can be used directly in engines as a pure form (R100), biodiesel is typically mixed with conventional diesel in lower proportions such as 2% (B2), 5% (B5), or 20% (B20). Both fuels are compatible with existing diesel engines in these common forms. However, higher biodiesel blends like B99 might necessitate modifications to vehicles.
Biodiesel
- Sustainable fuels such as modern bioenergy, hydrogen, and hydrogen derived fuels provide 85 EJ of energy in 2050, equal to global electricity demand today. By 2050 they support one quarter of global energy consumption.
- Demand and supply policies are needed to help stimulate production of sustainable fuels and close the gap to net zero. Demand side policies, innovation support and coordinated sustainability frameworks are needed.
- Biofuels, hydrogen, hydrogen derived fuels and electricity are all required to decarbonize transportation. To 2030 biofuels expand in all transport segments, with growth shifting to aviation and shipping to 2050.
- By 2050 there is no overall increase in cropland use for bioenergy production and no encroachment on forested lands from current levels.
- Biofuel demand is set to expand by more than 20% by 2028 with the potential to expand near 60% if planned policies are implemented and planned projects built. However, net zero would require quicker growth.
- Biofuel share of transport fuel remain steady in Europe and Asia & Pacific as biofuel demand expands with transport fuel demand. In North and South America biofuel demand expands quicker than oil demand, driving up shares.
- The United States, the European Union and Japan lead growth potential, with much faster growth possible if policies under discussion in Brazil, India, Indonesia, Singapore, the UAE, Malaysia and the United Kingdom are implemented.
- There is untapped potential to expand biofuel production using agricultural and forestry residues, crops grown on marginal land and intercropping.
Biodiesel, typically mixed with petroleum diesel, held the second-largest share of U.S. biofuel production and consumption in 2022, both at 9%. That year, the U.S. biodiesel figures were as follows: production reached 1.62 billion gallons, imports stood at 0.25 billion gallons, exports were 0.24 billion gallons, and consumption totaled 1.66 billion gallons.
Overall, the U.S. produced about 18.7 billion gallons of biofuels and consumed approximately 17.6 billion gallons in 2022. Notably, the country was a net exporter of biofuels, with a surplus of around 1.0 billion gallons exported over imported.
"So biodiesel is the form of energy that gets created by using several different feedstocks like soybean oil, canola oil, and the rest, and then they can be used in diesel engines across the U.S., across the globe. The great advantages of renewable fuels is they can use existing infrastructure, and so the biodiesel and renewable diesel can both be used in existing terminals, tanks, pipelines, and then all the way to the engines of the diesel engines and they can be used without any issue."
— Kevin Lucke, President of Chevron Renewable Energy Group
Liquid biofuels are one of the most sustainable and renewable options for decarbonizing the transport sector. Sustainable production of liquid biofuels offers numerous benefits including improved health, lower emissions, jobs, and local economic development. In 2023, 170 billion litres of biofuels were produced including bioethanol, biodiesel, HVO diesel, marine and aviation fuels. According to the latest IEA Renewables 2023 Report, biofuel demand is expected to increase by 23% reaching 200 billion litres by 2028.

2022 RES-T (Renewable Energy in Transport)
In 2022, the share of renewable energy in transport (RES-T) without multipliers accounted for 7.0% of the total energy mix, while fossil fuels dominated with 92.6%. Of the renewable segment:
- Crop-based biofuels constituted 48.6%.
- Other compliant biofuels made up 7.8%.
- Annex IX-A biofuels accounted for 11.7%.
- Annex IX-B biofuels comprised 16.7%.
- Renewable electricity's share was distributed as follows: 2.0% in road transport, 8.3% in rail transport, and 1.3% in other forms.
Overall, biofuels represented 88.4% of the renewable energy used in transport, whereas renewable electricity contributed 11.6%, primarily used in rail transport. Additionally, a specific mention is made of crop-based and Annex IX-B biofuels exceeding RED II caps by 0.4%."
Way Ahead for Liquid Biofuels
Biofuels' Role: Biofuels are essential for decarbonizing transport. They should continue playing a key role in this sector.
Crop-based Ethanol: This type represents 1% of EU agricultural land and brings many benefits.
Advanced Feedstocks: These are vital for augmenting biofuel supply and go beyond the capacity of crop-based options.
Standards and Regulations:
- E10 is the current standard for gasoline across most EU countries.
- Development of the E20 standard is underway at the European Committee for Standardization (CEN).
- E85 demand in France is on the rise, notable for being much cheaper than traditional gasoline.
Renewable Gasoline: Fossil fuel fractions are being replaced by renewable gasoline variants such as Bio-naphtha, eGasoline, and EtG.
Biofuels and Electricity: Both battery vehicles with renewable energy (BV+RE) and high-value biofuels (HV+biofuel) are necessary to complement the role of electricity in transport decarbonization.
The energy transition is supported by four critical strategies: enhancing long-term global policies, diversifying feedstocks, increasing investment in innovation, and standardizing sustainability protocols worldwide. Each year, a comprehensive analysis on reaching a net zero scenario shows that sustainable fuels, including biofuels, hydrogen, and hydrogen-derived fuels, will constitute a quarter of global energy consumption by 2050, equating to today's total electricity demand.
Currently, liquid biofuels and biogases are the sole commercial options available and are projected to see considerable expansion by 2030. Hydrogen and hydrogen-based fuels also have significant growth potential, expected to accelerate after 2030. Biofuels are essential for decarbonizing all transport segments, and their use in road transport could more than double by 2030, complementing electric vehicles and hydrogen-based fuels.
By 2050, a shift towards greater electrification in road transport may lessen the reliance on biofuels. However, their use will still be crucial in the aviation and shipping sectors, with substantial growth projected both up to and beyond 2030. Biofuel sustainability is rigorously managed with strict standards to avoid any increase in land used for dedicated biofuel crops and to prevent encroachment on forested lands.
Current global biofuel production accounts for about 4.5% of total transport fuel demand as of 2022-2023. Projections indicate a modest increase to 5% by 2028 under existing policies. However, an optimistic scenario considering all announced policies and projects suggests a potential 60% growth in biofuels demand, although this will still fall short of the net zero pathway, where it would need to reach 11% of transport demand.
In Europe and Southeast Asia, the share of biofuels in the transport mix is expected to remain steady despite overall growth, partially due to strong policies such as Europe's Renewable Energy Directive and a reduction in gasoline and diesel consumption. In contrast, North America shows significant growth potential, particularly for renewable diesel, though ethanol usage is declining due to decreased gasoline demand. Latin America, led by Brazil, anticipates substantial growth due to robust policy support and increasing fuel demands.
Biojet fuel expansion is particularly significant, with potential to make up nearly 1% of total jet fuel demand over the next five years under current policies, with room for further growth if global supportive policies are enacted.
Biofuel Trade: Challenges and Opportunities
In the transport sector, biofuels are primarily utilized, with some international trade occurring. Most countries opt to develop their biofuel resources domestically, focusing on energy security and supporting local agriculture. This domestic focus is aimed at reducing reliance on imported gasoline or diesel. Despite the current modest trade volumes, the future holds significant potential for increased international trade, especially in the aviation and shipping sectors due to their global operations.
For future growth, standardizing carbon accounting frameworks is crucial to facilitate international trade. Countries rich in feedstocks, capable of producing them with low carbon emissions, could become key players in the global biofuel market. For instance, Brazil's advancement in cellulosic ethanol production positions it well for international trade.
Concerns are rising in Europe about the sustainability and origins of imported biofuels, particularly used cooking oils. This underscores the importance of robust sustainability frameworks and traceability systems to ensure responsible sourcing and address the growing concerns as the supply of biofuels expands.
Biodiesel from palm oil presents unique handling and storage challenges due to its moisture-absorbing properties, necessitating specific storage solutions different from traditional fossil fuels. The price volatility of palm oil biodiesel is addressed in Indonesia through a palm oil levy that stabilizes prices, supporting the biofuel industry's economics.
Trade barriers are also significant, especially with exports to the EU and US. Indonesia, for instance, has faced challenges exporting biodiesel due to stringent EU regulations and is actively seeking resolutions through international platforms like the WTO.
The EU's renewable energy directive has been updated, setting ambitious targets to increase the share of renewable energy in transport to nearly 30% by 2030, up from the current target of 14%. This goal necessitates the incorporation of all available sustainable solutions and a technologically neutral approach. The directive uses "multipliers" which allow certain renewable resources to count multiple times towards targets, though this practice has faced criticism for potentially masking continued fossil fuel use.
In Europe, renewable ethanol plays a significant role, with major producers operating 50 plants across the EU and the UK. Ethanol offers substantial socio-economic benefits, providing income for farmers and quality employment in rural areas. The ongoing development of ethanol blends in gasoline, such as E20 and E85, alongside innovations like renewable gasoline, demonstrates the evolving landscape of biofuel utilization in Europe and the potential for replication in other markets.
For instance, E20 is being developed as a standard for gasoline in Europe, with significant interest from European automotive manufacturers. E85, a blend of 85% ethanol, is already a commercial reality in France and is supported for its economic and environmental benefits. In Spain, 100% renewable gasoline is available, offering a sustainable alternative to traditional fuels.
Geothermal Power
Geothermal plants, predominantly located in the Western United States, harness the Earth's internal thermal energy to generate electricity. These facilities operate similarly to coal or nuclear power plants but utilize a renewable heat source from beneath the Earth's surface. According to the Energy Information Administration (EIA), geothermal facilities across seven states contribute about 0.4% of the total U.S. energy output. Despite this modest domestic contribution, the U.S. holds approximately 25% of the world’s operational geothermal capacity, underscoring its significant role in the global geothermal energy landscape.
The U.S. Department of Energy estimates that to achieve 90 gigawatts (GW) of geothermal generation by 2050, the country needs to invest between $225 and $250 billion.
California leads the nation with the highest number of geothermal power plants, hosting 31 operated by electric utilities as of 2023.
Nevada is close behind with 26 plants. In that year, geothermal electricity generation in the U.S. peaked at 16.46 billion kilowatt hours.
- Chevron Corp has been selected for a pioneering project in Sonoma County, California, under the Enhanced Geothermal System Pilot Demonstrations grant. This project will employ innovative drilling and stimulation techniques to extract energy near an existing geothermal field.
- Fervo Energy Co. has been chosen for a project in Utah’s Milford Renewable Energy Corridor, adjacent to the DOE’s Frontier Observatory for Research in Geothermal Energy laboratory. This project aims to generate at least 8.0 megawatts (MW) of power from each of three wells.
- Mazama Energy is set to develop the first superhot Enhanced Geothermal System (EGS) on the western flank of Oregon’s Newberry Volcano, operating at temperatures above 375 degrees Celsius (707 Fahrenheit), which will advance the science of operating in extreme heat conditions.
- Fervo recently shared results from its drilling activities in February at the 400 MW Cape Station project in Utah, which surpassed the Department of Energy’s expectations for enhanced geothermal systems. Out of seven wells drilled, the fastest was completed in just 21 days, showcasing the successful adaptation of oil and gas drilling technologies to geothermal energy extraction.
TOP 10 Geothermal Plants in the U.S.
- The Geysers
The largest geothermal plant in the world, located in Northern California, The Geysers comprises 18 individual plants drawing steam from 376 active wells. It produces a remarkable 1,590 MW annually, which is double that of the next largest facility and contributes about 20% of California's renewable energy.
- Imperial Valley
This is the second-largest geothermal facility in the U.S., situated south of Los Angeles. The complex consists of 11 power stations, generating about 403.4 MW annually. The Imperial Valley Dry Stream Power Station is noted for its efficiency among geothermal plants.
- Coso
Located in the Mojave Desert in California, Coso is the third-largest, producing approximately 270 MW annually. An assessment in the 1970s predicted at least a 30-year lifespan for its geothermal resources.
- McGinness Hills
The largest geothermal complex outside California, situated in Nevada. It started with two plants in 2012 and added a third in 2018, collectively generating 138 MW annually.
- Desert Peak
Operating in Churchill County, Nevada, this facility began in 2006 with two plants that together produce 92 MW annually, utilizing both flash steam and binary cycle methods.
- Heber
In Imperial County, California, Heber produces about 81 MW annually through a binary cycle process that prevents water or steam contact with the turbines.
- Stillwater
Located in Nevada, Stillwater combines solar and geothermal power across 240 acres, including large solar fields. It produces 75 MW of power each year.
- Ormesa
Also in Imperial County, California, Ormesa is believed to provide 35 MW of sustainable energy to the Los Angeles Department of Water & Power and is currently generating 73.2 MW annually.
- Steamboat Hills
Since beginning operations in 1992 in Washoe County, Nevada, Steamboat Hills generates 73 MW annually. It's hoped to increase its capacity to 84 MW in the coming years using a mix of binary cycle and flash steam methods.
- Patua
The 10th largest geothermal plant in the U.S., located in Northern Nevada, Patua produces 70 MW annually. It's notable as the largest binary cycle plant built, currently supplying power to the Sacramento area under a 21-year agreement.

Electrofuel and Decarbonization
E-fuels, synthesized from green hydrogen and recycled CO2, are chemically identical to conventional fossil fuels but are carbon-neutral because they utilize recycled CO2. These fuels can be used seamlessly within existing infrastructure, allowing them to be distributed to current markets and utilized in existing vehicles such as cars, airplanes, and ships without the need to develop new markets. The success of e-fuels hinges on adequate policy support, including new pricing mechanisms.
The European Union has been a leader in crafting policies that support e-fuel adoption, particularly in the aviation sector. These policies provide clear demand signals, mandating the purchase of e-fuels to help decarbonize this hard-to-abate sector. Similar leadership and policy frameworks are needed to extend these practices to other challenging sectors like maritime shipping.
E-fuel production effectively recycles CO2, with current projects aiming to recycle about 25 million tons of CO2 annually. This approach not only reuses CO2 that is already present in the atmosphere but also helps reduce dependency on fossil fuels by displacing them with carbon-neutral alternatives. This displacement means that fossil fuels can remain unextracted, aligning with natural CO2 sequestration processes.
Despite the promising aspects of e-fuels, there are numerous challenges in scaling up this technology. One major challenge is the extensive and often prolonged environmental permitting required to build the necessary infrastructure. The financial outlay for constructing such facilities ranges significantly, with projected costs between $2 billion and $8 billion depending on the scale and location. These operations demand a large supply of renewable electricity and CO2, necessitating long-term contracts that underpin project financing and ensure economic viability.
Successful implementation examples include a facility in Chile, which produces e-methanol and e-gasoline. This plant serves both the shipping industry and automotive partners, like Porsche, which uses the e-gasoline for racing events and in its experience centers. This facility, designed to demonstrate the integration and efficiency of e-fuel technology, operates at an impressive 80% capacity factor, powered by just one wind turbine.
Plans are in place to expand these initiatives globally with significant projects underway. Engineering efforts are ongoing in Texas for what is slated to become the first large-scale commercial e-fuel project, expected to produce 1.4 million tons of ethanol annually. Similar projects are also being developed in Tasmania, Australia, and Pandu, Uruguay, illustrating the global commitment to scaling up e-fuel production as part of broader efforts to limit global warming to 1.5 degrees Celsius above pre-industrial levels and to meet global emissions targets.
If you are looking for more information about energy companies, their assets, and energy deals, please, contact our sales office mapping@hartenergy.com, Tel. 619-349-4970 or SCHEDULE A DEMO to learn how Rextag can help you leverage energy data for your business.
These 8 US States Now Get Most of Their Renewables: Solar, Wind and More
![$data['article']['post_image_alt']](https://images2.rextag.com/public/blog/301_Blog_These 8 US States Now Get Most of Their Renewables Solar, Wind and More.jpg)
Last year, a Pew Research Center survey revealed that 67% of Americans are in favor of developing alternative energy sources. Similarly, an Eligo Energy survey indicated that 65% of U.S. consumers are prepared to pay a premium for renewable energy. According to Mordor Intelligence, the U.S. renewable energy market is projected to reach 434.5 GW in 2024, with further growth expected at an annual rate of 10.01%, reaching 700.15 GW by 2029.
Why Are Oil Giants Backing Away from Green Energy: Exxon Mobil, BP, Shell and more
![$data['article']['post_image_alt']](https://images2.rextag.com/public/blog/328_Blog_Why Are Oil Giants Backing Away from Green Energy Exxon Mobil, BP, Shell and more .jpg)
As world leaders gather at the COP29 climate summit, a surprising trend is emerging: some of the biggest oil companies are scaling back their renewable energy efforts. Why? The answer is simple—profits. Fossil fuels deliver higher returns than renewables, reshaping priorities across the energy industry.
As world leaders gather at the COP29 climate summit, a surprising trend is emerging: some of the biggest oil companies are scaling back their renewable energy efforts. Why? The answer is simple—profits. Fossil fuels deliver higher returns than renewables, reshaping priorities across the energy industry.
![$data['article']['post_image_alt']](https://images2.rextag.com/public/blog/327_Blog_Oil Market Outlook A Year of Growth but Slower Than Before.jpg)
The global oil market is full of potential but also fraught with challenges. Demand and production are climbing to impressive levels, yet prices remain surprisingly low. What’s driving these mixed signals, and what role does the U.S. play?
![$data['article']['post_image_alt']](https://images2.rextag.com/public/blog/326_Blog_USA Estimated Annual Rail CO2 Emissions 2035.jpg)
Shell overturned a landmark court order demanding it cut emissions by nearly half. Is this a victory for Big Oil or just a delay in the climate accountability movement?