Comprehensive Energy Data Intelligence

Information About Energy Companies, Their Assets, Market Deals, Industry Documents and More...

Energy-Infrastructure-Analysis-at-Your-Fingertips

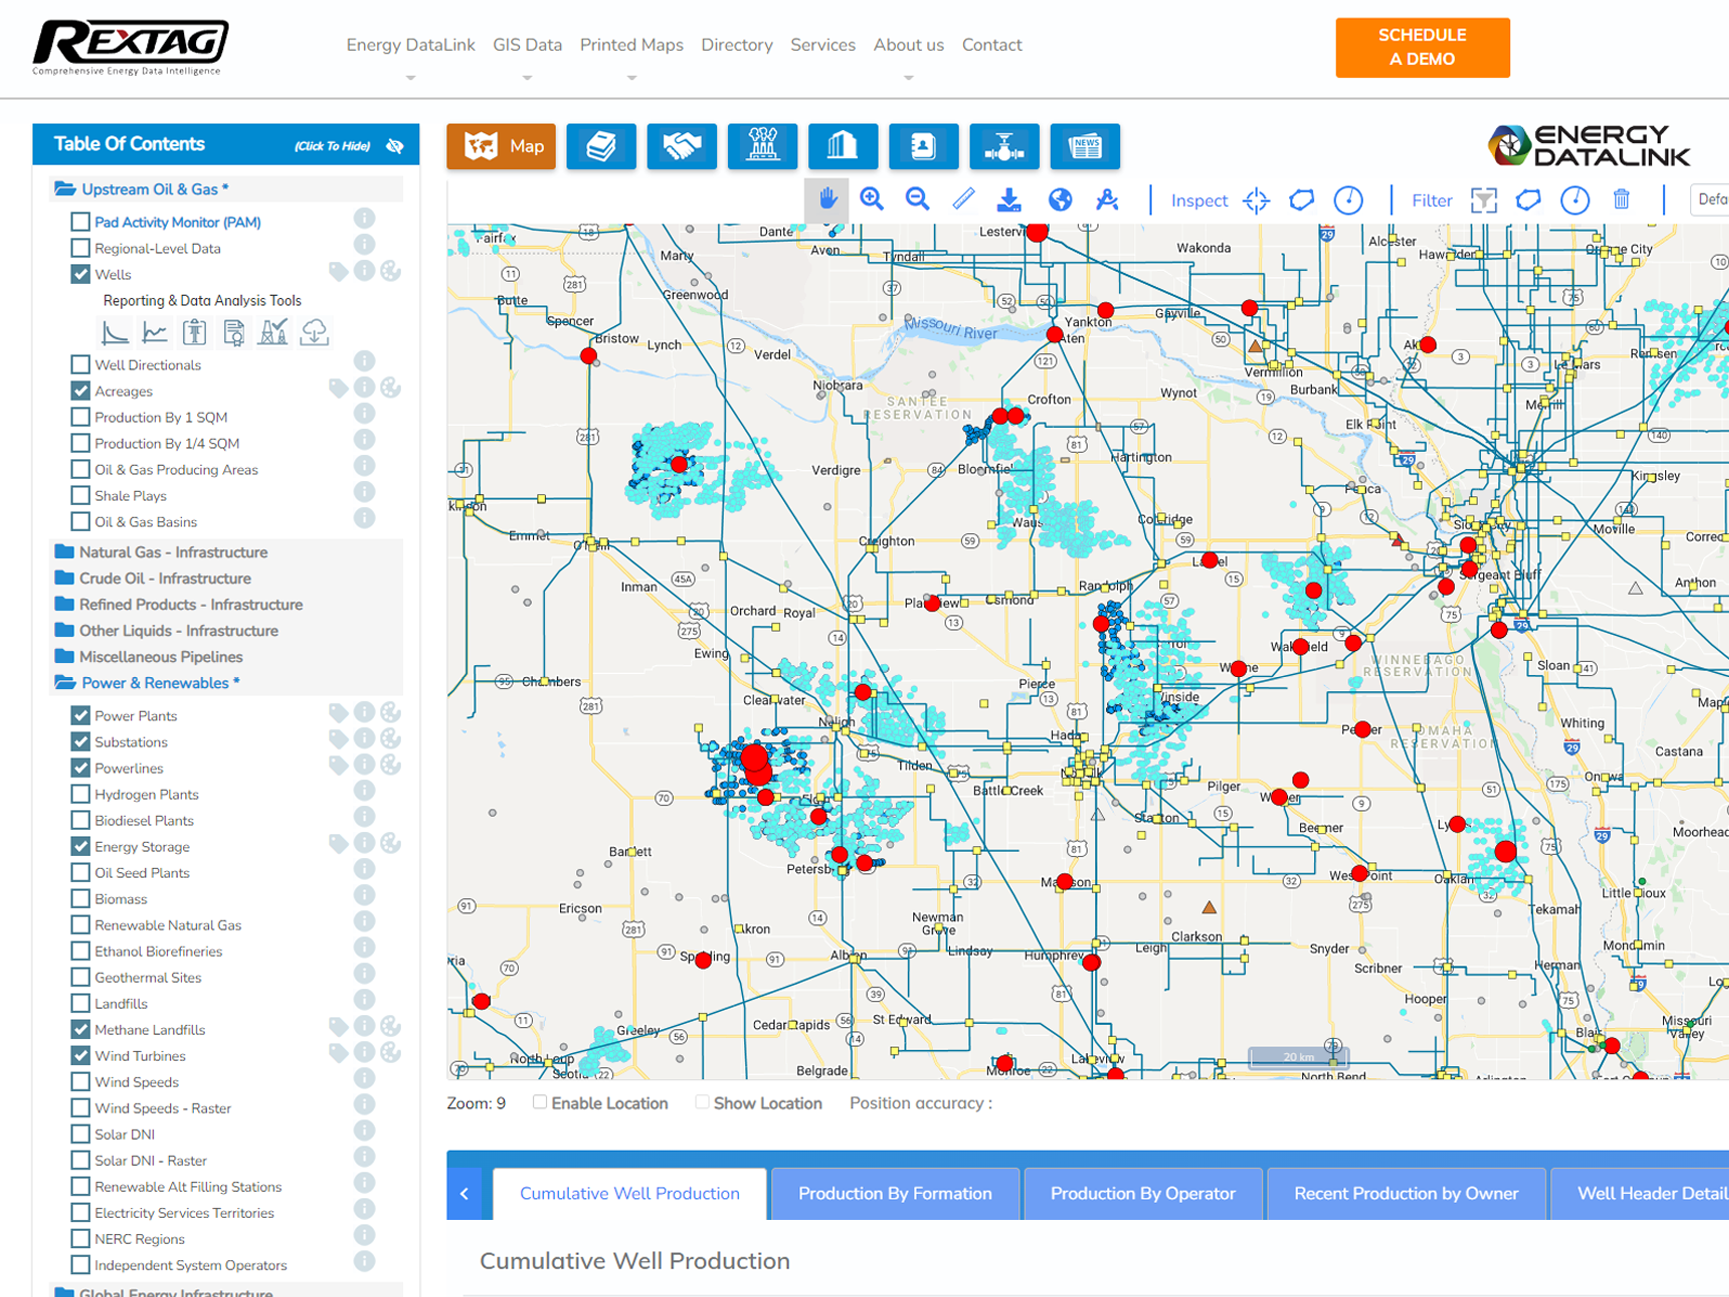
Below is our ESG-focused webinar review. We reviewed several cases how companies can improve their ESG performance. Many options have been demonstrated of how access to the data Rextag provides can help you make your companies business more “green”. 

Rextag collects and maintains data on energy infrastructure (for well production, completions, permits, pipelines and gathering systems attached to those wells, facilities involved in processing and transportation of hydrocarbons, all the way to downstream to power generation, refining, electrical infrastructure and renewables assets).  

We license the data by datasets, the ones you see on the left pane within the Energy DataLink application. Our customers can license access to the data based on the folders (or modules) here. e.g. Upstream oil and gas, operators and other modules below. 

They are delivered to the customers in different ways. If you are familiar with GIS databases or SQL you can consume the data in those forms or set up web services connection to your cloud database. Otherwise, our web-based service is accessible to an unlimited number of users for visualization and consumption if you are not a GIS user.


If you do not need to save the raw data on your computer, you can access our web application that you now see in the video. 

We also cover gathering systems, compressor stations and processing plans. Then we go down to the infrastructure for transportation, including pipelines,  to downstream, i.e. refineries, refined pipelines, also including power generation, and all electrical infrastructural. You can choose one module or combine some of them.  

Together with that, you have access to all the auxiliary datasets you see below here. If you want to get parcel data or any common interest data, PLSS, TX survey data, townships or even weather services, all those things are included in any license. 

We have the largest document library, consisting of more than 5 million investment presentations and annual reports. All of these are accessible to you. You also have A&D transactions data, as we keep track of what activity is going on in the market, the merges, and the acquisition. 

Another service is access to the Corporate Entities database. There is a lot of information on financial statements, public trades with companies, what assets they own, etc.  

Speaking about the Directory, if you are in the business development or with a service company it can be used for lead generation. We have over 300,000 contacts including their telephone numbers and emails for almost all operators in this industry. Regardless of the information that you license, all these datasets are included in the price.  

As you can imagine the key usage scenarios depend on what kind of customer you are. So if you are an Upstream oil and gas, an E&P company, the key scenarios could be  

  • looking for what is the production of a particular well, 
  • looking for production trends, 
  • looking at opportunities that might be for acquisitions or new field development. 

On the other hand, if you are a midstream company or one of the vendors or you are from a consulting company, or somebody who does services for the midstream and infrastructure, you can use this application for the business-development purposes: 

  • filter by pipelines
  • their types
  • operators
  • location
  • get additional information about these pipelines
  • see some of our customers in the midstream industry. 

Being a midstream company, you know where your assets are, but we are here to tell you where some of your competitors are. For example, we license the data for about 90 per cent of major midstream companies in the US.

The data we use for making pipeline analysis and looking at where the pipelines are, where their potential acquisitions are, or empty connections that can be used to bring the product to market and where it is currently located. 

Looking downstream, some companies and renewable energy industry companies look at our application, where the electrical infrastructure is, the location and perhaps the potential to locate new infrastructure for power generations. Through some functionalities within the application, many of our customers generate strong value out of it.

I will now pass this on to Tyler Reitmeier, our Ciorporate Business Development Director with Rextag (Hart Energy).


Thank you, Rey. I am pleased to share with you some cases of how Rextag can help you as a user to identify opportunities for ESG improvement. We title our webinar “Is ESG Improvement Next Door?” from the perspective of an owner and an operator of assets. This means you might find opportunities for lower carbon footprint operations through identification of the co-located infrastructure you can take advantage of. 

It is also useful for services, companies who do the same for their clients and likewise oil and gas investors in utility companies and industrial power users.

So, what I filtered ещ on the screen is a particular set of Ovintiv assets north of Big Spring in TX in the Permian for utilization in our example of how to improve ESG performance today and how you can use Rextag to support that too. 

I have filtered specifically to Ovintiv’s wells and turned on the labeling on the acreage, so you can see who operates that acreage - I can then turn it back off.

By default, we have colour-coding based on what well is predominantly producing. A green well will be predominantly producing oil, a red well will be producing gas. A yellow polygon here is Ovintiv’s acreage. Through the inspection tool, you can bring up the data associated with assets that are on the map. In this case I choose the area and draw a circle inside of which you can see all the data associated with this area. Starting from well details you are able to get information about production, completion, spud date, BOE, production rates, permit numbers, the API number, etc. Clicking on the eyeball icon of any well, there will be a Well Report Card with more details about the selected well, its location, depths and dates, completion and production summaries as well as permit information. I can also see monthly and daily production. Completion info can include the FracFocus data on who competed and worked on the well. 

In the same way, you can choose another folder and see the data about acreage.

Similarly I can look at operators, who owns the asset, any type of documents and so on, BOE per SQM for the acreage, the associated shale play, etc.. Having an interest in a particular acreage you can go to additional documents by clicking on the link and search for different criteria mentioned before using the same interface.

Moving back to the main screen, I move now to the same wells, or a set of wells, to show you some ESG workflows that I have in mind here. 

I now zoom in and change the background to show you the alignment of maps and Rextag data. (We have various backgrounds so looking at these wells using the satellite imagery map, we can see there are not many well pads there yet - actually three of these so that are some wells drilled recently that satellite images have not updated yet. 

Now we are going to explore some theoretical ideas around demonstration of the ESG improvement. 

Upstream Case. Using up the Flaring Gas

Let us suppose these two wells are flaring their associated gas - these are green (heavy crude producing) wells - so we want to figure out what to do with that associated gas. 

The first step would be asking: 1) Are there any natural gas lines near here that can potentially tie to? 

So I turn on the natural gas pipeline layer and then I identify who owns those pipelines near me. For that I can turn on labels and see Targa and WTG as operators around. I am also using inspection tool to find out more about these pipelines. I am able to see who owns the assets and some of the key aspects of those assets, such as what the pipeline diameter is, the type of it is, and sub-system names. I can see any transactions associated with these pipelines, so Targa owns some, WTG onws others. I can potentially get in contact with those who I determined if there is the capacity I can connect to. So that will be the first step. 

2) What if it there was no capacity available to me? My next step for ESG improvement might be the following. Instead of flaring its associated gas I could produce power, possibly with temporary generators. So what I need to know is: can I return that power to the utility system? So coming down to our Power and Renewables folder, I will turn on substations which are going to be yellow boxes and powerlines which are the blue lines. I turned off the gas midstream ones and turned on the other layer. Hopefully, you will be able to see a substation just north of my set of wells. Now I am focused here and something that I can do is determine how far away (using a ruler tool) it is from those wells. And it looks to be about one mile away. 

Likewise, I can determine other utilities being two-thirds of a mile away from the middle point between these wells. So that gives me an idea what is an easy way to determine how close these particular assets are. I can find this Luther substation that does actually exist here because I can see it on the satellite, which is helpful to me too. Now I know that one already exists and I can go find out who is the owner of that asset to determine is it something that I can connect into. 

3) Moving to the next step, let us say I have been able to connect to the natural gas piping and thus I am able to take this associated gas and put it into the gathering system. Still, I want to improve my ESG performance further. If I need power for pumps, etc. at the side of these wells, I can look to source this power from renewable assets. I will add some of the renewable assets that can be potentially in the area - turn on Methane Landfills, Wind Turbines, Energy Storage (the battery storage associated with solar or wind). I will move back up and zoom out for you. 

Now we can determine what types of assets will be in the area. It looks like there are a lot of them. So, now that I see power plants represented by red circles, I will change the color-scheme to show me the renewable vs. fossil-fuel ones. Green now represents renewables. I can thus determine what power sources are near me. The other thing that I want to show is the energy storage, they are these purples boxes and then batteries will be triangles. Likewise, I can zoom back in on the two wells that we were looking at earlier. I can now see there is a set of wind turbines near. In this case the two ones are yet proposed ones. (The light ones are proposed, the dark ones are operational.  The way I can figure that out is by looking at the legend). 

What I can do then is to measure and figure out that there is a couple of miles to get to this energy source that would be completely renewable coming from wind power. I can figure out who exactly owns that power plant and turn on its company name on the map. Then I can contact them and figure and if it would possible for me to work with them. That is just an example of how we can use Upstream and Midstream in association with the Power and Renewable energy datasets.

Midstream Case. Powering NG Compressors

 Another screen is going to be associated with midstream. So I have midstream piping north-east of the previous location. As you can see, I have got the red gas piping and then compressor stations, which are represented by the blue squares, and I can label the compressor station, so I am going to focus on this one, in particular. 

The idea being, I might run my compressors on gas for the most part and I might electrify some of those to improve my ESG score. The first step would be to determine what assets are related to the utility system near me. I see that I have these blue power lines and I can determine how far away those are. Coming a little bit to the west I can see that have the yellow square ones which represent the substation that I can potentially tie into. So I could build a substation here and take it into account. Taking the step further, I can see some proposed windmills over here and can go and figure out who is the owner. I can then connect with them and determine if supplying wind power for any power need that I would have would be a fit. 

These have been just a few few examples of how Upstream and Midstream operators and service providers can utilize Rextag platform, to accelerate their ESG improvement opportunities.

 The analysis of wells depends on what you want to get. So, you might start with choosing the filter “Natural Gas Pipelines” and then turn on labels in order to see who owns the assets in this place. 

 The next step might be looking at powerlines and substations in “Power and Renewables” folder. Put some power plants, substations, powerlines, and wind turbines. If you are a company that has an interest in electrical infrastructure, you can use this application for the same process in order to know 

  • who owns it, 
  • what is the nearest substation for your project that you can connect with, 
  • who is the operator of this line,
  • all the information will be there and can be extracted in the same way.

To see how your wells are far away from them, it is possible to use a ruler tool. By choosing different filters you can save these maps for later and share them with our team.

If you work on multiple different projects, one of these for example in Texas and different operators, filters and layers you can save this map for later. In the addition, you can share it with your team, for somebody who leads the project and develops the infrastructure.

There is quite a lot of interactivity that is built into the application to work with teams because it is an unlimited number of users license that we offer. You have an ability to collaborate within your company. 

You also can export the information in different formats CSV, PDF, Petra, PhDWin and Geographix to import into the other software to do more analysis. 

There is an ability to upload the data. If you have your data or data of the third companies that you want to upload into the application, it accepts shapefiles as well as KMZs. You also can draw your assets in it. If you are involved in the development of the pipelines you can draw these pipelines within the application, save and export it, as well as share them with other people in your team. We haven’t covered other datasets that are above the map here, but we will give you FREE trial access to the application and you can through navigate some of these things on your own and see how they can be used in your teams.

Thank you for your attention and participation in this webinar. See you in our next sessions.

If you are looking for more information about energy companies, their assets, and energy deals, please, contact our sales office mapping@hartenergy.com, Tel. 619-349-4970 or SCHEDULE A DEMO to learn how Rextag can help you leverage energy data for your business.


Streamlining ESG Management in Oil & Gas: Simplify Compliance with the Latest Standards

$data['article']['post_image_alt']

To effectively manage ESG issues in O&G companies, a comprehensive approach is required, addressing multiple managerial issues. First, ESG considerations must be integrated into the corporate strategy, setting goals that align with business objectives, reflected in budgeting, capital allocation, and risk management. Accurate and efficient collection, management, and reporting of ESG data is necessary for identifying relevant metrics and indicators, such as greenhouse gas emissions, water consumption, and social impact indicators.

Exploring ESG in Upstream Operations: Examining Achievements, Obstacles, and Emerging Patterns

$data['article']['post_image_alt']

ESG considerations are becoming increasingly essential for companies operating in the upstream sector. Failure to address ESG concerns may result in financial and reputational risks, given the growing focus from investors, regulators, and other stakeholders. Companies must prioritize ESG performance and engage with stakeholders to address concerns and mitigate risks. By doing so, they can improve their reputation, attract investment, and contribute to a more sustainable future

$data['article']['post_image_alt']

The Williston Basin is a big area filled with layers of rock that sits next to the Rocky Mountains in western North Dakota, eastern Montana, and the southern part of Saskatchewan in Canada. This area covers roughly 110,000 square miles. Geologically, it's very similar to the Alberta Basin in Canada. People started drilling for oil in the Williston Basin back in 1936, and by 1954, most of the land where oil could likely be found was already claimed for drilling. The Bakken Formation with parts of Montana, North Dakota, Saskatchewan, and Manitoba has become one of only ten oil fields globally to yield over 1 million barrels per day (bpd) since the late 2000s. It is currently the third-largest U.S. shale oilfield, behind the Permian and Eagle Ford. The boom in the Bakken started around September 2008, coinciding with the U.S. housing market crash. The application of new technologies, such as swell packers enabling multiple-stage fracturing, significantly enhanced oil recovery, making the Bakken Formation a key player in the U.S. In 2022, the Bakken oil field saw big improvements in how much oil and gas it could produce. At the start of the year, 27 drilling rigs were working there, more than double the 11 rigs from the start of 2021. Important upgrades included making the Tioga Gas Plant able to process 150 million cubic feet more gas each day, and making the Dakota Access Pipeline bigger, increasing its oil transport capacity from 570,000 to 750,000 barrels every day.

$data['article']['post_image_alt']

Continental Resources is expanding its operations in the Midland Basin, including taking over some assets that used to belong to Occidental Petroleum. The company plans to use its expertise in exploration in this area.

$data['article']['post_image_alt']

Equinor and EQT Corporation have agreed that Equinor will exchange its operated assets in the Marcellus and Utica shale formations in Ohio for a stake in EQT’s non-operated interests in the Northern Marcellus formation.

2022 oil production 2023 2024 3D Earth Science Analytics 3D Modeling Continental Resources 3D modeling 3D modeling CGG 3D modeling ESA 3D visualization 3D visualization CGG A&D A&D deals A&D sector A&Ds in the Gulf of Mexico AAII ANR Pipelines Abraxas Petroleum Acquisition Acquisitions Admiral Permian Resources Advance Energy Advance Energy Partners Holdings LLC Aera Energy Aethon Energy Africa Alaska Pipeline System Alberta Alberta pipeline Algeria Align Midstream LLC Alliance Pipeline AltaGas Altamont Energy Alternative Fuels Ameredev II Anadarko Anadarko Basin Analysis Analytics And Rockcliff Energy Andrews Antero Midstream Antero Midstream Corp. Antero Resources Antitrust Apache Corporation Appalachia Appalachia to Market and Middlesex Extension project Appalachian Appalachian Basin Appalachian basin Aramco ArcLight Capital Partners ArcLight Capital Partners LLC Archaea Energy Inc. Arena Energy LLC Argentina Arrow Midstream Artesia Natural Gas Gathering and Processing System Ascent Resources Asia Asset Holdings Assets Acquisition Assets Revenue Assets Sale Assets Value Athabasca Oil Atlantic Coast Pipeline Australia Autry Stephens Aux Sable Aux Sable Canada Aviation emissions BASF BG Group BHP Billiton BOED BP BP Plc BPX Energy Baker Hughes Bakken Bakken Formation Bakken Shale Bakken shale Bankruptcy Barnett Barnett Shale Bay du Nord Baytex Baytex Energy Berkshire Hathaway Big Horn Biodiesel Bison Midstream Black Bear Transmission Blackstone Energy Partners Blackstone Inc. Blockchain Bloomberg Brazil Brazos Valley Brent BridgeTex Broom Creek Formation Buyout Firms CBAM CCS CDM Resource CGG CNOOC CNOOC International CO2 CO2 reduction COG Operating CVX Cactus II Pipeline Calgary Callon Callon Petroleum Canada Carbon Capture Carbon Footprints Carbon capture and storage Cardinal Midstream Partners Careers in O&G Caribbean map Carl Icahn Carnelian Energy Castleton Commodities Cenovus Cenovus Energy Centennial Resource Centennial Resource Development Centennial Resource Development Inc. Charlson Gathering System Cheniere Energy Cheniere Marketing Chesapeake Chesapeake Energy Chesapeake Energy Corp. Chesapeake Energy Corporation Chevron Chevron Corp. China China Gas Holding LTD. Chord Chord Energy Christmas Cibolo Energy Partners Cimarex Energy Civitas Civitas Resources Clay basin Clean Energy Clearwater Climate Change Coal Codell Colgate Energy Colgate Energy Partners Colgate Energy Partners II LLC Colgate Energy Partners III Colonial Enterprises Colonial Pipeline Colorado Columbia Columbia Gas pipeline Columbia Gulf pipeline Comisión Federal de Electricidad Comprehensive Analysis Comstock Resources Concho Valley Solar Congo ConocoPhillips ConocoPhillips Co. Consolidated Edison Contango Resources Continental Resources Continental Resources Inc. Corpus Christi Costa Azul Coterra Energy Coterra Energy Inc. Cove Point Cove Point LNG Cox Operating LLC Credit Suisse Group Crescent Crescent Energy Crescent Point Crescent Point Energy Crescent Point Energy Corp. Crestwood Crestwood Equity Crestwood Equity Partners Crestwood Equity Partners LP Crestwood Midstream Crestwood Permian Basin Holdings LLC Crowheart Energy CrownQuest CrownRock Crude Oil Crude Prices Crude oil D-J Basin DCP DCP Midstream DJ Basin DOJ DUCs on the Rise Dakota Access Pipeline Dallas Data Dawson Debt Restructuration Decarbonization Technology Decarbonized Fuel Delaware Delaware Basin Delaware basin DelawareBasin Denbury Denmark Denver Denver Julesburg Denver-Julesberg Basin Denver-Julesburg Basin Devon Devon Energy Diamondback Diamondback Energy Diamondback Energy Inc. Dimsdale Gas Dividends Dominion Energy Dominion Energy Questar Pipeline Double E Pipeline DoublePoint Energy DowJones Downstream Market Driftwood Energy Operating LLC Driftwood Pipeline LLC Drilling Drilling Inventory Durham Creek Durham Creek Exploration Duvernay Duvernay shale E&P EDF EIA EIEC EIG ENB EOG EOG Resources EP Energy EPA EQT ESG ESG performance ESG score ESGcriteria ESGinvestment ESGstandarts Eagle Ford Eagle Ford M&As Eagle Ford Shale Earth Science Analytics Earthstone Earthstone Energy Earthstone Energy Inc. East Coast East Texas Eastern Energy Gas Ector Eddy County Egypt El Paso Natural Gas Pipeline Elba Liquefaction Emerson Emerson Electric Emissions EnCap EnCap Flatrock EnCap Flatrock Midstream EnCap Investments EnLink Midstream EnVen Energy EnVen Energy Corp. Enable Midstream Enbridge Enbridge Energy Enbridge Inc Enbridge Pipeline Encap Flatrock Midstream Endeavor Endeavor Energy Endeavor Energy Resources Endeavor Gathering Energy Energy Assets Energy Crisis Energy Gas Energy Information Administration Energy Infrastructure Energy Leaders Energy M&A deals 2022 Energy M&As Energy Prices Energy Production Energy Projects Energy Resources Energy Security Energy Transfer Energy Transfer Canada Energy Transfer LP Energy Transport Solutions Energy security Enerplus Ensign Natural Resources Enterprise Enterprise Product Operating LLC Enterprise Products Enterprise Products Partners Environmental Protection Agency Epic Crude Pipeline Equinor Equinor Energy Ireland Equitrans Equitrans Midstream Equitrans Midstream Corp. Equity Investments Ethanol Conversion Europe Evolution Petroleum Exaro Energy III Exok Exploration Export Expro Exxon Exxon Mobil Exxon Mobil Corp. ExxonMobil FTC Fayetteville Shale Federal Trade Commission Financial Times FireBird Energy FireBird Energy LLC Florida Gas Transmission Flowing Gas Forecast Forgan Forge Energy Fort McMurray FortunaResources Franklin Howard G&P GHG GIP GIS GIS NG data GIS U.S. GIS U.S. NG Data GIS U.S. NG data GIS U.S. data Galapagos Gas Gas Extraction Gas Flaring Gas Holdings Gas Processing Plants Gas Production Gas Rates Gas processing Gathering Gathering and Processing Gathering and Transportation Network Gemini Carthage Genesis Energy Genovesa Germany Glencore Glenn Wright Global Emissions Global Infrastructure Partners Goldman Sachs Goodrich Grand Prix NGL Pipeline Gray Oak Pipeline Gray Oak pipeline Grayson Mill Grayson Mill Energy Great River Hydro LLC Great Western Petroleum Greater Green River Green Canyon Green River Basin Greenhouse Gas Emissions Grupo Carso Guangzhou Gas Gulf Coast Gulf Coast Pipeline System Gulf Mexico map Gulf Oil Corporation Gulf Run Pipeline map Gulf map Gulf of Mexico Gulf of Mexico US map Gulf of Mexico depth map Gulf of Mexico map Gulf of Mexico oil rig map 2023 Gulf of Mexico on map Guyana Halliburton Company Hammerhead Hammerhead Energy Harbour Energy Hart Energy HartEnergy Harvest Midstream Haynesville Haynesville Basin Haynesville Shale Heavy crude Henry Energy Henry Resources Hess Hess Corporation Hess Midstream Hibernia Energy Hilcorp Energy Horizontal Well Houston Humble Midstream Hydraulically Stimulated Resources Hydro-Québec Hydrocarbon Exploration Hydrocarbon Reservoirs Hydrogen IEA IKAV IMEO INEOS Energy IPO Import Inc. India Indonesia Inergy Inergy Midstream Infrastructure Inter Pipeline International Energy Agency Iran Iron Mountain Ironwood Midstream J.P. Morgan JUSTCapital Japan Joint Venture Jonah Field Jordan Cove KAPS KKR KKR&Co. KMI Karnes Trough Kaybob Duvernay Kazakhstan Key Access Pipeline System Key statistics Keyera Corp Keystone XL Pipeline Kimbell Kimbell Royalty Kimbell Royalty Partners Kinder Morgan Kinder Morgan Inc. Kingston Midstream Alberta Kirkuk oil Komipo America Kosmos Energy LEG project LM Energy LNG LNG Delivery LNG Demand LNG Terminals LNG delivery LNG exports LNG plant LNG provider LNG-by-rail LP LaBarge Labrador Lake Charles Project Laredo Petroleum Lario Permian Lario Permian LLC Lea County Leasehold Properties LetterOne Leucrotta Exploration Libya Lime Rock Lime Rock New Energy Lime Rock Partners Lime Rock Resources Line 3 Pipeline Line 3 project Liquefaction Plant Liquefied Natural Gas Liquefied natural gas Liquids and Natural Gas Pipelines Lloyds Banking Lone Star Express Pipeline LongHorn Lotus Midstream Louisiana Louisiana Energy Gateway Lucid Energy Group Lycos Energy M&A M&As MLP MLPs MMP MPLX MPLX LP MVP Magellan Magellan Midstream Magellan Midstream Partners Mainline Pipeline System Mancos Shale Maple Energy Marathon Marathon Oil Marathon Oil Corp. Marathon Oil Corporation Marathon Petroleum Marcellus Marcellus Basin Marcellus Shale Marcellus region Mariner East Project Mariner east expansion Market Acquisition Of Vine Energy Inc. Market Analysis Marten Hills Pipeline Martin Martin County Maryland Mascot Project Matador Matador Resources Matador Resources Co Matagorda Medallion Midstream Services Medallion Pipeline Merge Merger Merit SI Meritage Midstream Mesa Minerals Partners Mesquite Energy Methane Methane Emissions Methane emissions Methane gas Mewbourne Oil Co. Mexico Mexico Pacific MiQ Mica Midcoast Energy LLC Midcontinent Middle East Midland Midland Basin Midland-Petro D.C. Partners LLC MidlandBasin Midstream Midstream M&As Midstream NG gathering pipelines Midwest Mississippi Mobil Oil Momentum Midstream LLC Monopoly Mont Belvieu Montana Montney Montney Shale Moriah Henry Motiva Enterprises Mountain Valley Mountain Valley Pipeline MountainWest Pipeline Mountrail Gathering System Murphy Murphy Oil NEP NG Pipeline Maps NG U.S. midstream data NG data NG data U.S. NG gathering pipeline systems NG pipeline maps NG3 NGL NGL Energy Partners NGL export NGL logistics NGL pipelines NGL production NGLs NGO NGP NLG NOG NRGreen NTX pipeline NZE National Instruments Natural Gas Natural Gas Assets Natural Gas Certification Natural Gas Equivalent Natural Gas Gathering Natural Gas Infrastructure Natural Gas Liquids Infrastructure Natural Gas Prices Natural Gas Production Natural Gas Products Natural gas pipelines Natural gas production Navitas Midstream Net Acres Net-zero Production New Fortress New Jersey New Mexico New Year Newco Newfoundland NextEra NextEra Energy NextEra Energy Partners Niobrara Niobrara Shale Noble Energy Noble Midstream Partners LP Non-Operated Assets North America North Dakota North Texas Barnett North-East Northern Delaware Basin Northern Natural Gas Northern Oil and Gas Northern Oil and Gas Inc. Northwoods Norway NuStar NuStar Energy Nuevo Midstream O&G O&G Production O&G output records O&G production O&G production forecasting OKE OMOG ONEOK ONEOK Bakken OPEC OPEC+ OXY Oasis Midstream Oasis Midstream Partners Oasis Petroleum Oasis Petroleum Inc. Occidental Occidental Petroleum Offshore Ohio Oil Oil & Gas Oil Equivalent Oil Prices Oil Sanctions Oil and Gas Oil and Gas Production Oil and Gas Properties Oil and Gas production Oil and Gas rigs Oil and gas production Oil companies Oil&Gas Oklahoma Omega Acquisition Inc. OneRock OneRock Energy Onshore Ontario Teachers’ Pension Plan Operated Wells Orphan Basin Oryx Outrigger DJ Outrigger DJ midstream Ovintiv Oxy Oxy Low Carbon OxyChem PAM PBA PCC PDC Energy PDCE PHMSA PPG PRT Offshore Pacific Pad Activity Monitor Paradigm Paradigm Midstream Paradox Basin Paramount Resources Ltd. Parsley Energy Pearl Energy Investments Peavine Pecos Pecos Oil & Gas Pecos Oil & Gas LLC Pecos River processing plant Pembina Pembina Pipeline Pembina Pipeline Corp. Penn Virginia PennEast Pipeline PennEnergy Resources LLC PennTex Midstream Pennsylvania Percussion Petroleum Permian Permian Basin Permian Basin 2022 Permian Deep Rock Oil Co. Permian Producers Permian Resource Corp. Permian Resources Permian Resources Corp. Permian acreage sale Permian basin PermianBasin PermianResources Petro-Hunt Petrochemical Commercial Company Petrochemical production Petroleum Petroleum Production Peyto Peyto Exploration Phillips 66 Piceance Pickering Energy PickeringEnergy Pine Wave Energy Partners Pinnacle Midstream Pioneer Pioneer Natural Pioneer Natural Resources Pipeline Pipeline Maps Pipeline Performance Group Pipeline and Hazardous Materials Safety Administration Pipelines Pipelines and Refineries Pipestone Condensate Pipestone Phase Placid Montney Plains Plains All American Plains Pipeline Plato Point Pleasant Pony Express Pipeline Powder River Powder River Basin Powder River basin Power Generation Power Plant Fuel Power River basin Prairie Operating Processing plants Production Production Forecast Propane PureWest Quantum Capital Quantum Energy Partners Quantum Technology QuarterNorth QuarterNorth Energy Questar Pipeline RBC Capital RNG RSG Rangeland Energy Rangeland Midstream Canada Ranger Oil Rattler Midstream Reagan county Red Trail Energy RedBird Capital Partners Reduction of Greenhouse Emissions Reeves Reeves County Regional Energy Access Renewable Renewable Diesel Renewable Energy Group Repsol Repsol Canada Research Responsibly Sourced Gas Reuters Rextag Ridgemar Energy Riley Exploration Riley Exploration Permian Inc. RimRock Ring Energy Ring Energy Inc. RiverBasin Riverstone Rockcliff Rockcliff Energy Rockies Rockies Express Pipeline Rocky Mountain Rocky Mountains Rocky mountain Rover pipeline Rudolf Rudolf Red Nose Russia Rystad Energy SAF SEC SHLX SM Energy SPA STX Midstream Sabine Pass LNG LP Safety Administration Saguaro Energía San Andres formation San Mateo Sanchez Energy SandRidge Santa Santa Clause Santander Saskatchewan Saudi Arabia Schlumberger Limited Schneider Digital Scope 1 Scope 2 Sedimentary Basin Select Water Solutions SemGroup Sempra Energy Senate Sendero Midstream Sequestration Shale Shale Field Shale Formation Shale Gas Shale Industry Shale Oil Producer Shareholder Returns Shares Shawcor Shell Shell Midstream Partners Shell New Energies Shell Oil Company Shell PLC Shell Plc. Shell UAS Sierra Grande Silver Hill Energy Partners III SilverBow SilverBow Resources Sinochem Group Skye MS Sour crude South Carlsbad Natural Gas Gathering System South Haynesville Basin South Texas Southcross Energy Southeast Gateway Southeast Supply Enhancement Project Southern Access expansion Southern Lights Pipeline Southern Union Southwest Gas Southwest Gas Holdings Southwestern Energy Southwestern Energy Company Spain Spraberry Formation Sprng Energy Stagecoach Gas Standard Oil of New Jersey Standing Rock Indian Reservation Steel Reef Infrastructure Corp. Sterling DJ Sterling DJ system Stock Market Stonepeak Partners LP Stonepeak Partners. Storage Strategic Petroleum Reserve Strategic Resources Stronghold Energy Sumitomo Summit Midstream Summit Midstream Holdings Summit Midstream Partners Summit Midstream Partners LP Summit’s Lane System Sunoco Sunrise Oil Sands TAPS TC Energy TC Energy Corp. TC PipeLines LP TG East Texas Resources TG Natural Resources TGNR THQ Appalachia TRP Tailwater Capital Takeaway Tallgrass Energy Talos Talos Energy Talos Energy Inc. TalosEnergy Tap Rock Resources Targa Resources Targa Resources Corp. Tenaris Tesoro High Plains Pipeline Tesoro Logistics Texas Texas Eastern Pipeline Texas Gas Transmission Texas Oil Texas Panhandle Texon Oil and Land Company The Appalachian Basin The Denver-Julesburg Basin The Permian Basin The United States Tidewater Midstream Titus Oil & Gas Production LLC Tivoli Tivoli Midstream Tivoli Services Tokyo Gas Tokyo Gas America Tokyo Gas Co. Ltd. TokyoGas TotalEnergies Trace Midstream Trans Mountain pipeline TransCanada Transco Transcontinental pipeline Transport Permit Transportation Infrastructure Trends Tres Palacios Tri-State Water Truist Securities Tug Hill Tug Hill Operating U.S. U.S. Gulf Coast U.S. LNG exports U.S. NG data U.S. NG midstream data U.S. NG upstream U.S. NG upstream data U.S. crude exports U.S. crude oil data U.S. energy U.S. energy M&A U.S. energy data U.S. energy industry U.S. energy maps U.S. hydrogen production U.S. midstream data U.S. refineries U.S. shale gas assets U.S. upstream data UAE UK UPC US US NG US gas US oil USA USA Compression Partners USgas USoil Uinta Uinta Basin Uintah Basin Ukraine Unit Corporation Unit Petroleum Company United States Upstream Upstream M&As Upstream companies Upton county Utah Utica Basin Utica Shale Utilization Van Hook Gathering System Vencer Energy Venezuela Vermilion Energy Vermont Business Magazine HQI US Holding LLC Viking Viper Energy Viper Energy Partners Vista Pacifico Vital Energy Vital Energy Inc. Vitol WCS WPX Energy WTI Waha Hub Wamsutter Field War Warburg Pincus Ward Warren Buffett Water Management Water management Wattenberg Webinar Webster Pipeline Well maps Wells West Texas Western Canada Select Western Canadian Sedimentary Basin Western Midstream Western Midstream Partners White House WhiteHawk WhiteHawk Energy Whiting Whiting Petroleum Wholesale WildFire Energy I LLC William Companies Williams Williams Companies Williston Williston Basin Willston basin Wintershall Dea Wolfcamp Formation Woodford Woodford Express Woodland Midstream II Wyatt Resources Wyoming XCL Resources XTO Energy XcL Midstream Zacks Consensus Zephyr Energy Zhejiang Energy Acquisition Acquisitions Acreage Acreage maps Acreage sale Acreage sales Acreage valuation Acres Analytics And Phillips 66 Partners And Rockcliff Energy Asset renewal Asset sale Assets Assets merger Atural gas gathering Aviation Aviation fuel Barrel Barrels Bbl Bioenergy Bioethanol Boe Carbon capture and storage Carbon capture storage (CCS) Carbon emissions Carbon footprint Carbon-free Cash Coating Crude Crude export terminals Crude exports to Europe Crude oil Crude oil and natural gas output Crude oil delivery Crude oil production Deal Divestitures Divestment Drilling activity Drilling permits Dry gas Ecology Efficiency Electrification Emission reduction Emissions Emissions reduction Energy Energy M&A Energy acquisitions Energy deals Energy infrastructure Energy maps Energy market Energy provider Energy services Energy supplies Energy transfer Environment Expansion Exploration Exploration & production Financial results Flaring gas Forecast Fuel Fuel transportation Gas Gas prices Gas projects Gas rig Gasoline Gathering systems Geologic CO2 storage Global energy system Green energy Greenhouse gas Greenhouse-gas emissions Growth Horizontal drilling Hydraulic fracturing (fracking) technology Hydrogen pipeline maps Industry Interactive maps of oil rigs in the Gulf of Mexico Investment Joint ventures Laws Liquefied natural gas Liquified natural gas Low emissions Low-carbon fuel Management Map of Caribbean Map of pipelines Master limited partnership Merger Merger and acquisition Mergers Midstream Midstream footprint Midstream infrastructure Mineral Natural gas Natural gas gathering and processing Natural gas maps Natural gas pipelines Natural gas producer Natural gas production News Offshore Offshore oil and gas Oil Oil & gas Oil and energy Oil and natural gas assets Oil demand Oil market Oil output Oil prices Oil producers Oil rigs Oil supply Onshore Partnership Petroleum Petroleum infrastructure Pipeline Pipeline maps Pipelines Power Processing plants Produced water Production Rating Rebranding Refinery Renewable energy Renewable energy sources Renewable natural gas Renewables Report Sanctions Shale Simulation Smart contract Smart contracts Software Standards Stock Storage Subsurface CO2 sequestration Subsurface characterization Surface Sustainability The Gulf map The James Lake System The Permian Basin Transaction Transactions Undrilled locations Upstream Upstream production Water management Well Well maps Well redevelopment Wells Wet gas Wind energy