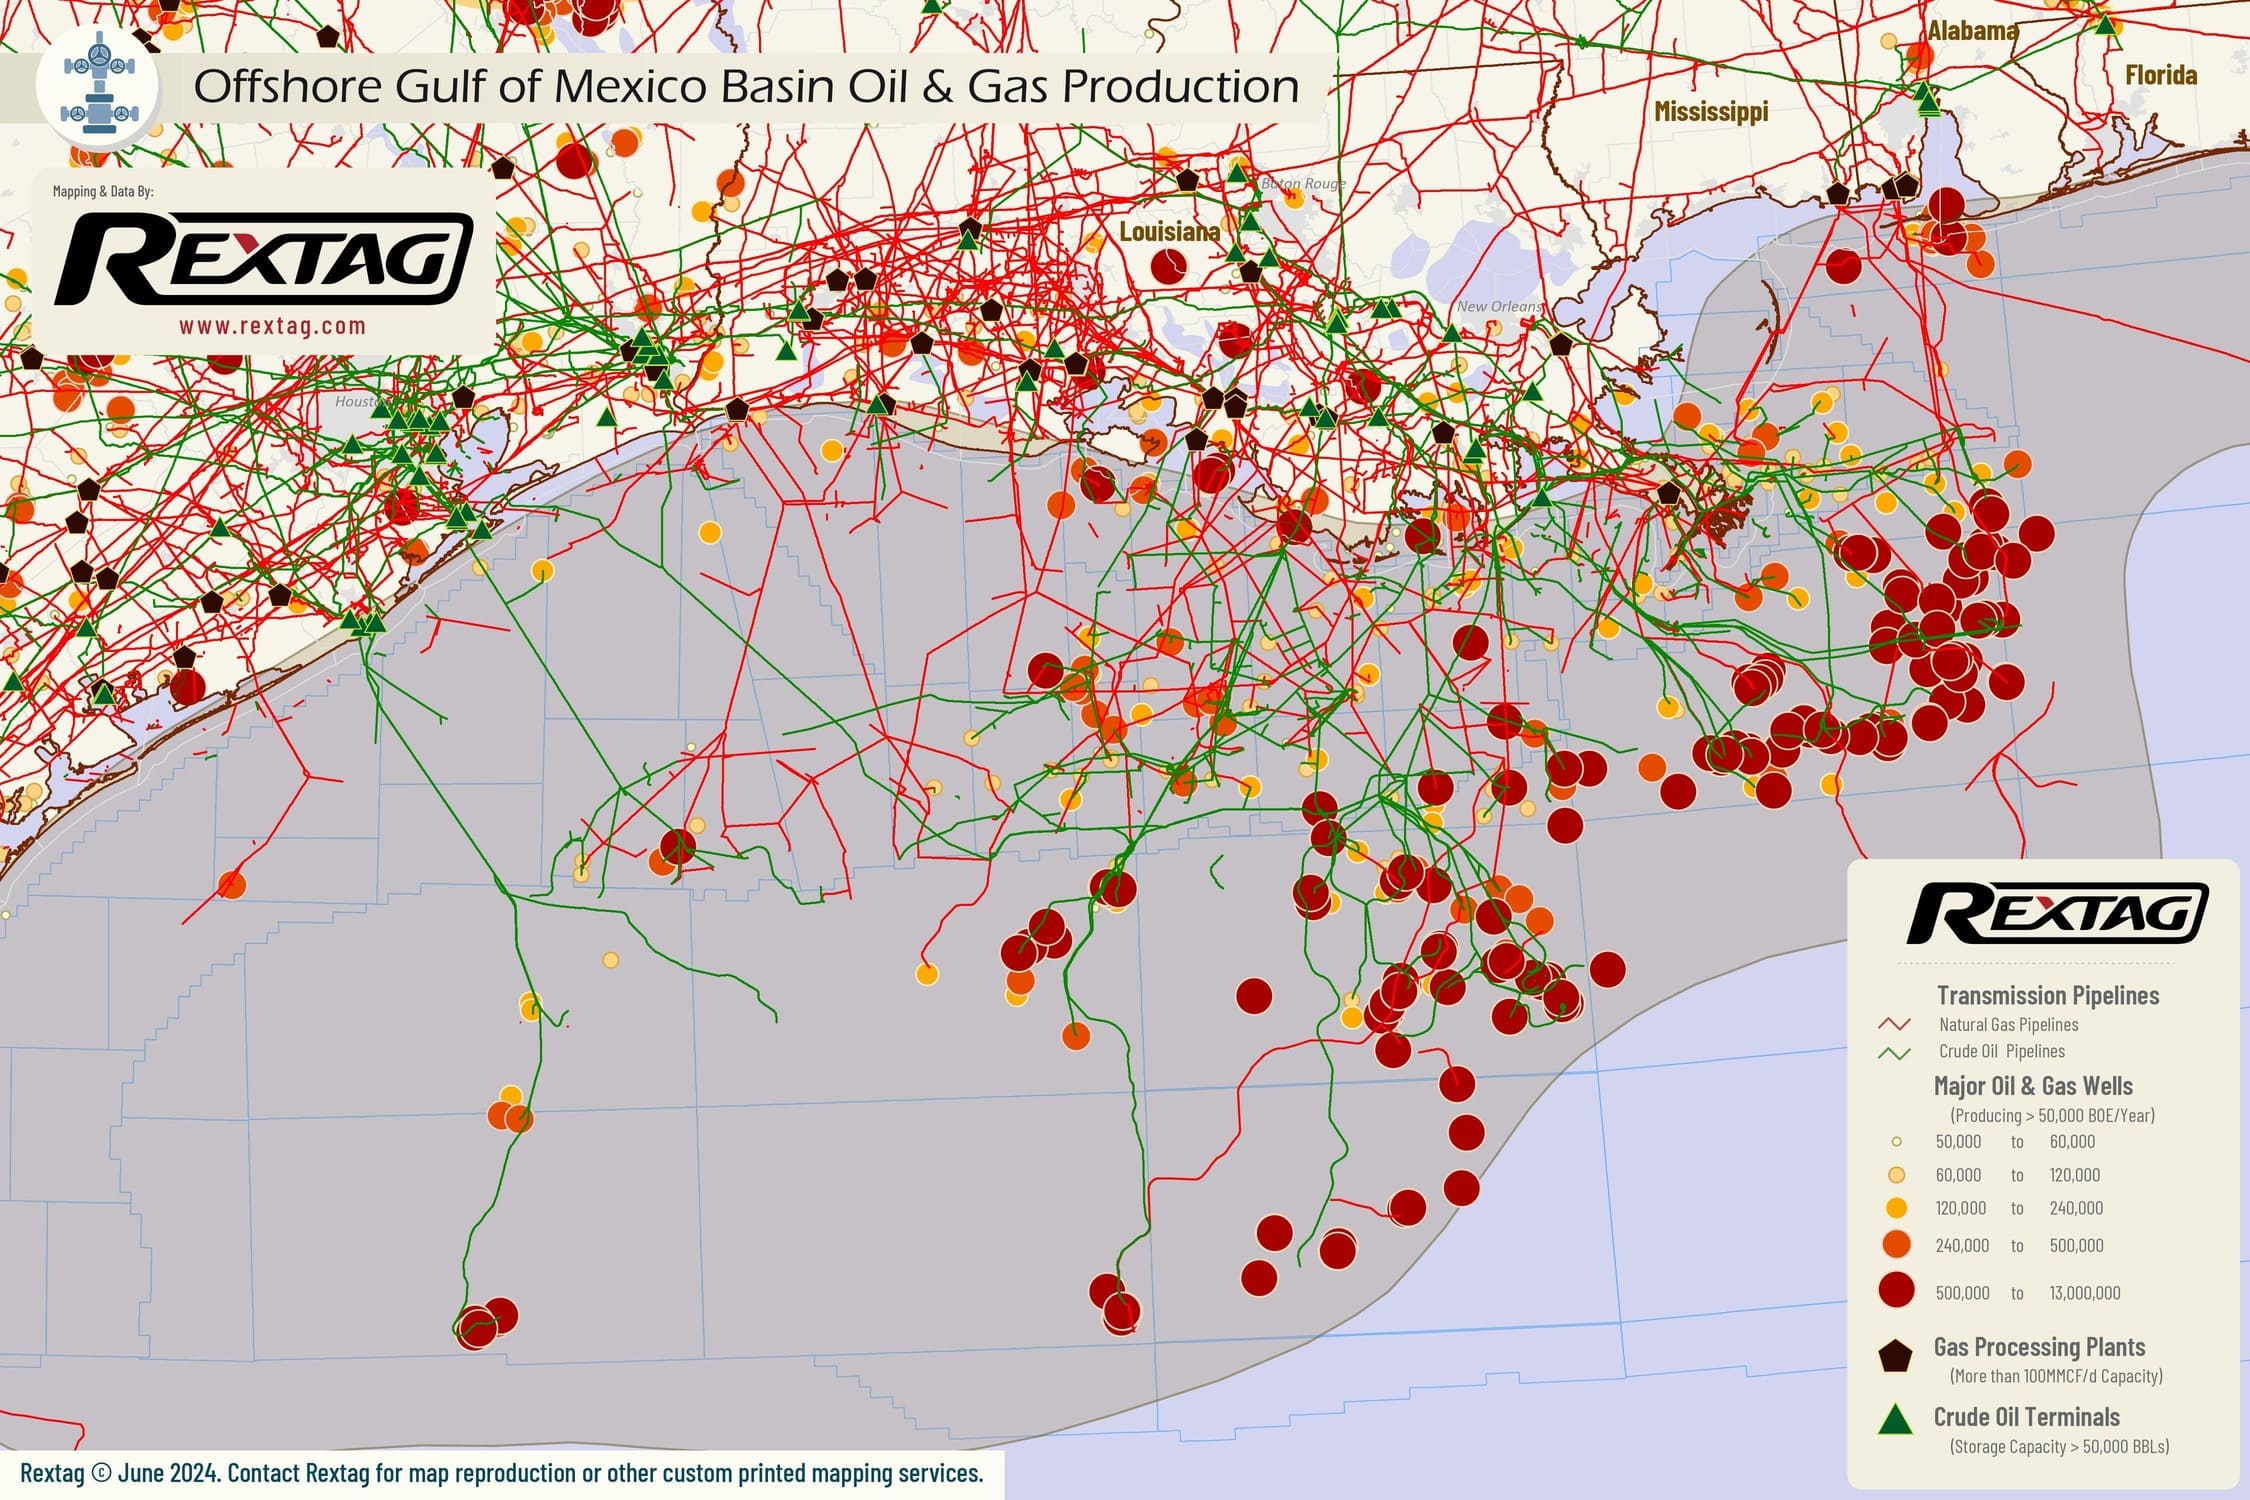
Offshore Gulf of Mexico - Upstream Oil & Gas

Description

The average measured depth of oil and gas wells in the offshore Gulf of Mexico can vary significantly due to the different geological targets and technological capabilities. One of the deepest wells ever drilled in this region is the Knotty Head No. 1 discovery well, which reached a total measured depth of approximately 34,189 feet? (Chevron Corporation)?. As of June 2023, the daily production level was at around 1,86 million barrels of oil per day and 2,2 million BOE per day.

upstream oil and gas
Production Summaries
Monthly Production
Presented Data in the chart below is delayed - LOGIN FOR UPTODATE
Production by Operator
Production by Formation
Production by County
Top 10 wells
API Operator Trailing 12 Months BOE Total BOE Total Gas (MCF) Total Oil (BBL)
60-811-40601-0200 Anadarko Petroleum Corporation 5,751,247.67 32,624,633.00 26,372,634.00 28,229,194.00
60-811-40652-0100 Anadarko Petroleum Corporation 5,893,605.50 30,548,339.33 27,327,602.00 25,993,739.00
60-811-40726-0000 Chevron USA, Inc. 7,342,040.00 22,685,539.83 53,505,797.00 13,767,907.00
60-811-40748-0200 Murphy Exploration & Production Company 5,641,294.17 13,410,972.67 10,266,226.00 11,699,935.00
60-817-41011-0100 BP Exploration & Production, Inc. 5,894,588.00 67,493,211.67 31,390,528.00 62,261,457.00
60-817-41198-0200 Shell Offshore, Inc. 6,472,924.17 8,008,732.17 8,453,725.00 6,599,778.00
60-817-41251-0000 Shell Offshore, Inc. 5,814,088.17 12,115,521.17 11,565,823.00 10,187,884.00
60-817-41330-0000 BP Exploration & Production, Inc. 5,613,021.17 18,790,364.00 8,851,476.00 17,315,118.00
60-817-41384-0000 Shell Offshore, Inc. 6,895,307.83 6,945,529.17 2,322,427.00 6,558,458.00
60-817-41445-0000 Shell Offshore, Inc. 6,377,003.50 16,085,200.83 9,705,707.00 14,467,583.00
Completion Summaries
Avg Depths

Wells Depth

Min
0
Max
36,022
Avg
9,320

Wells Vertical Depth

Min
0
Max
36,022
Avg
9,103

Wells Lateral Length

Min
0
Max
8,081
Avg
35

Wells Measured Depth

Min
0
Max
37,743
Avg
11,378
Well Counts by Categories

Wells By Formation

Formation
Well Count
Miocene
42
Norphlet
28
5800 Rb
10
T Rc
10
Brs 20 5200 Ras
7
4450 Sand
6
Brs 20 5800 Ra
6
Brs20 5800
5
Cib Op 3
4
B - 15
3

Wells By Status

Status
Well Count
Inactive, P/A
50,290
Unknown
15,881
Active
3,036
Cancelled
2,294
Shut-in
1,710
Permitted
50
Drilling
14

Wells By Trajectory

Trajectory
Well Count
Unknown
70,800
Vertical
1,687
Directional
663
Horizontal
45

Wells By Operator

Operator
Well Count
Chevron
10,126
Riverstone
4,570
COX Operating
2,582
Arena Energy
2,287
W&T Offshore
2,180
Talos Energy
2,118
Cantium
1,370
Hilcorp
760
Whitney O&G
682
Texas Petroleum
390
Well Completions
Presented Data in the chart below is delayed - LOGIN FOR UPTODATE
Well Permits
Presented Data in the chart below is delayed - LOGIN FOR UPTODATE
Completion by Operators
Completion by County

Rextag Energy DataLink™ Comprehensive Energy Intelligence Energy DataLink provides the largest and most complete database on energy infrastructure assets in North America. The Energy DataLink database contains asset ownership, production records, processing capacities, physical locations, planned projects, acquisition records and much more.