
American Gas - Data & Map Book
- 2024
700 Pages - 220 Maps - 1,000s of Tables & Charts!
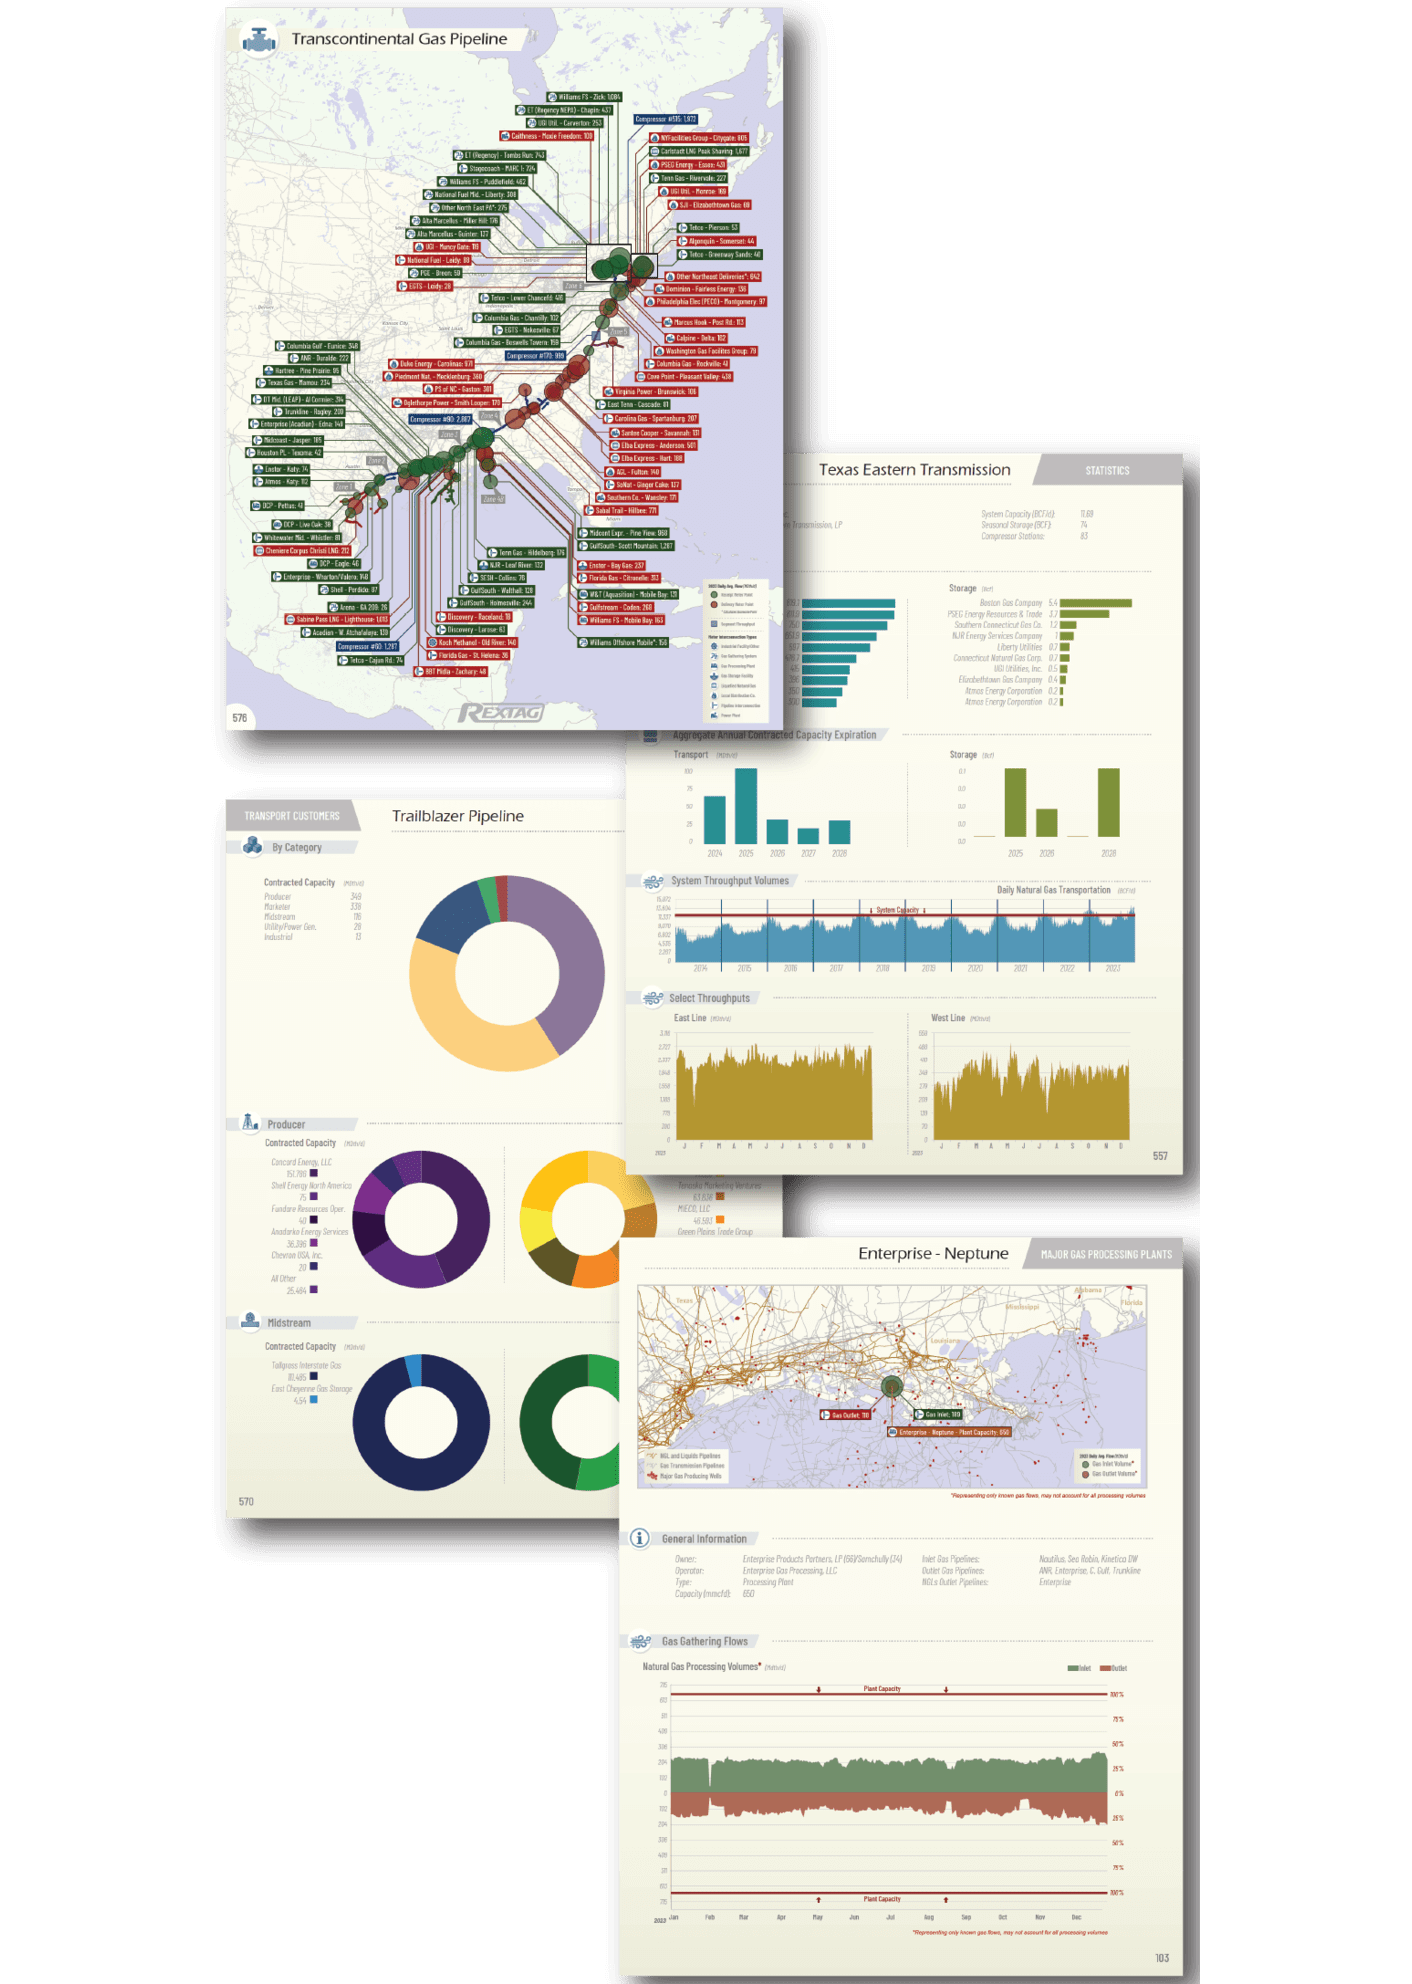
American Gas is designed to serve as the standard annual reference guide for the natural gas industry. We trust that you will find this new edition of the “Map Book” invaluable in your daily business activities American Gas represents the largest and most ambitious effort to date to visually represent natural gas data and maps.
American Gas follows a logical process for the natural gas industry, beginning with sections that cover data on historical production trends by basins, midstream gathering companies, and major gas processing plants. The journey continues through transmission pipelines, gas storage facilities, LNG export terminals, and culminates with historical trends within internal US markets, including a brief examination of gas consumption in major markets.
American Gas is broken down into seven chapters covering production, gathering, processing, transportation, LNG exports and market consumption.
- Natural Gas Producing Basins
- Midstream Gathering
- Natural Gas Processing Plants
- Interstate Natural Gas Assets
- Intrastate Natural Gas Pipelines
- LNG Export Terminals
- Natural Gas Regional Markets
Natural Gas Producing Basins
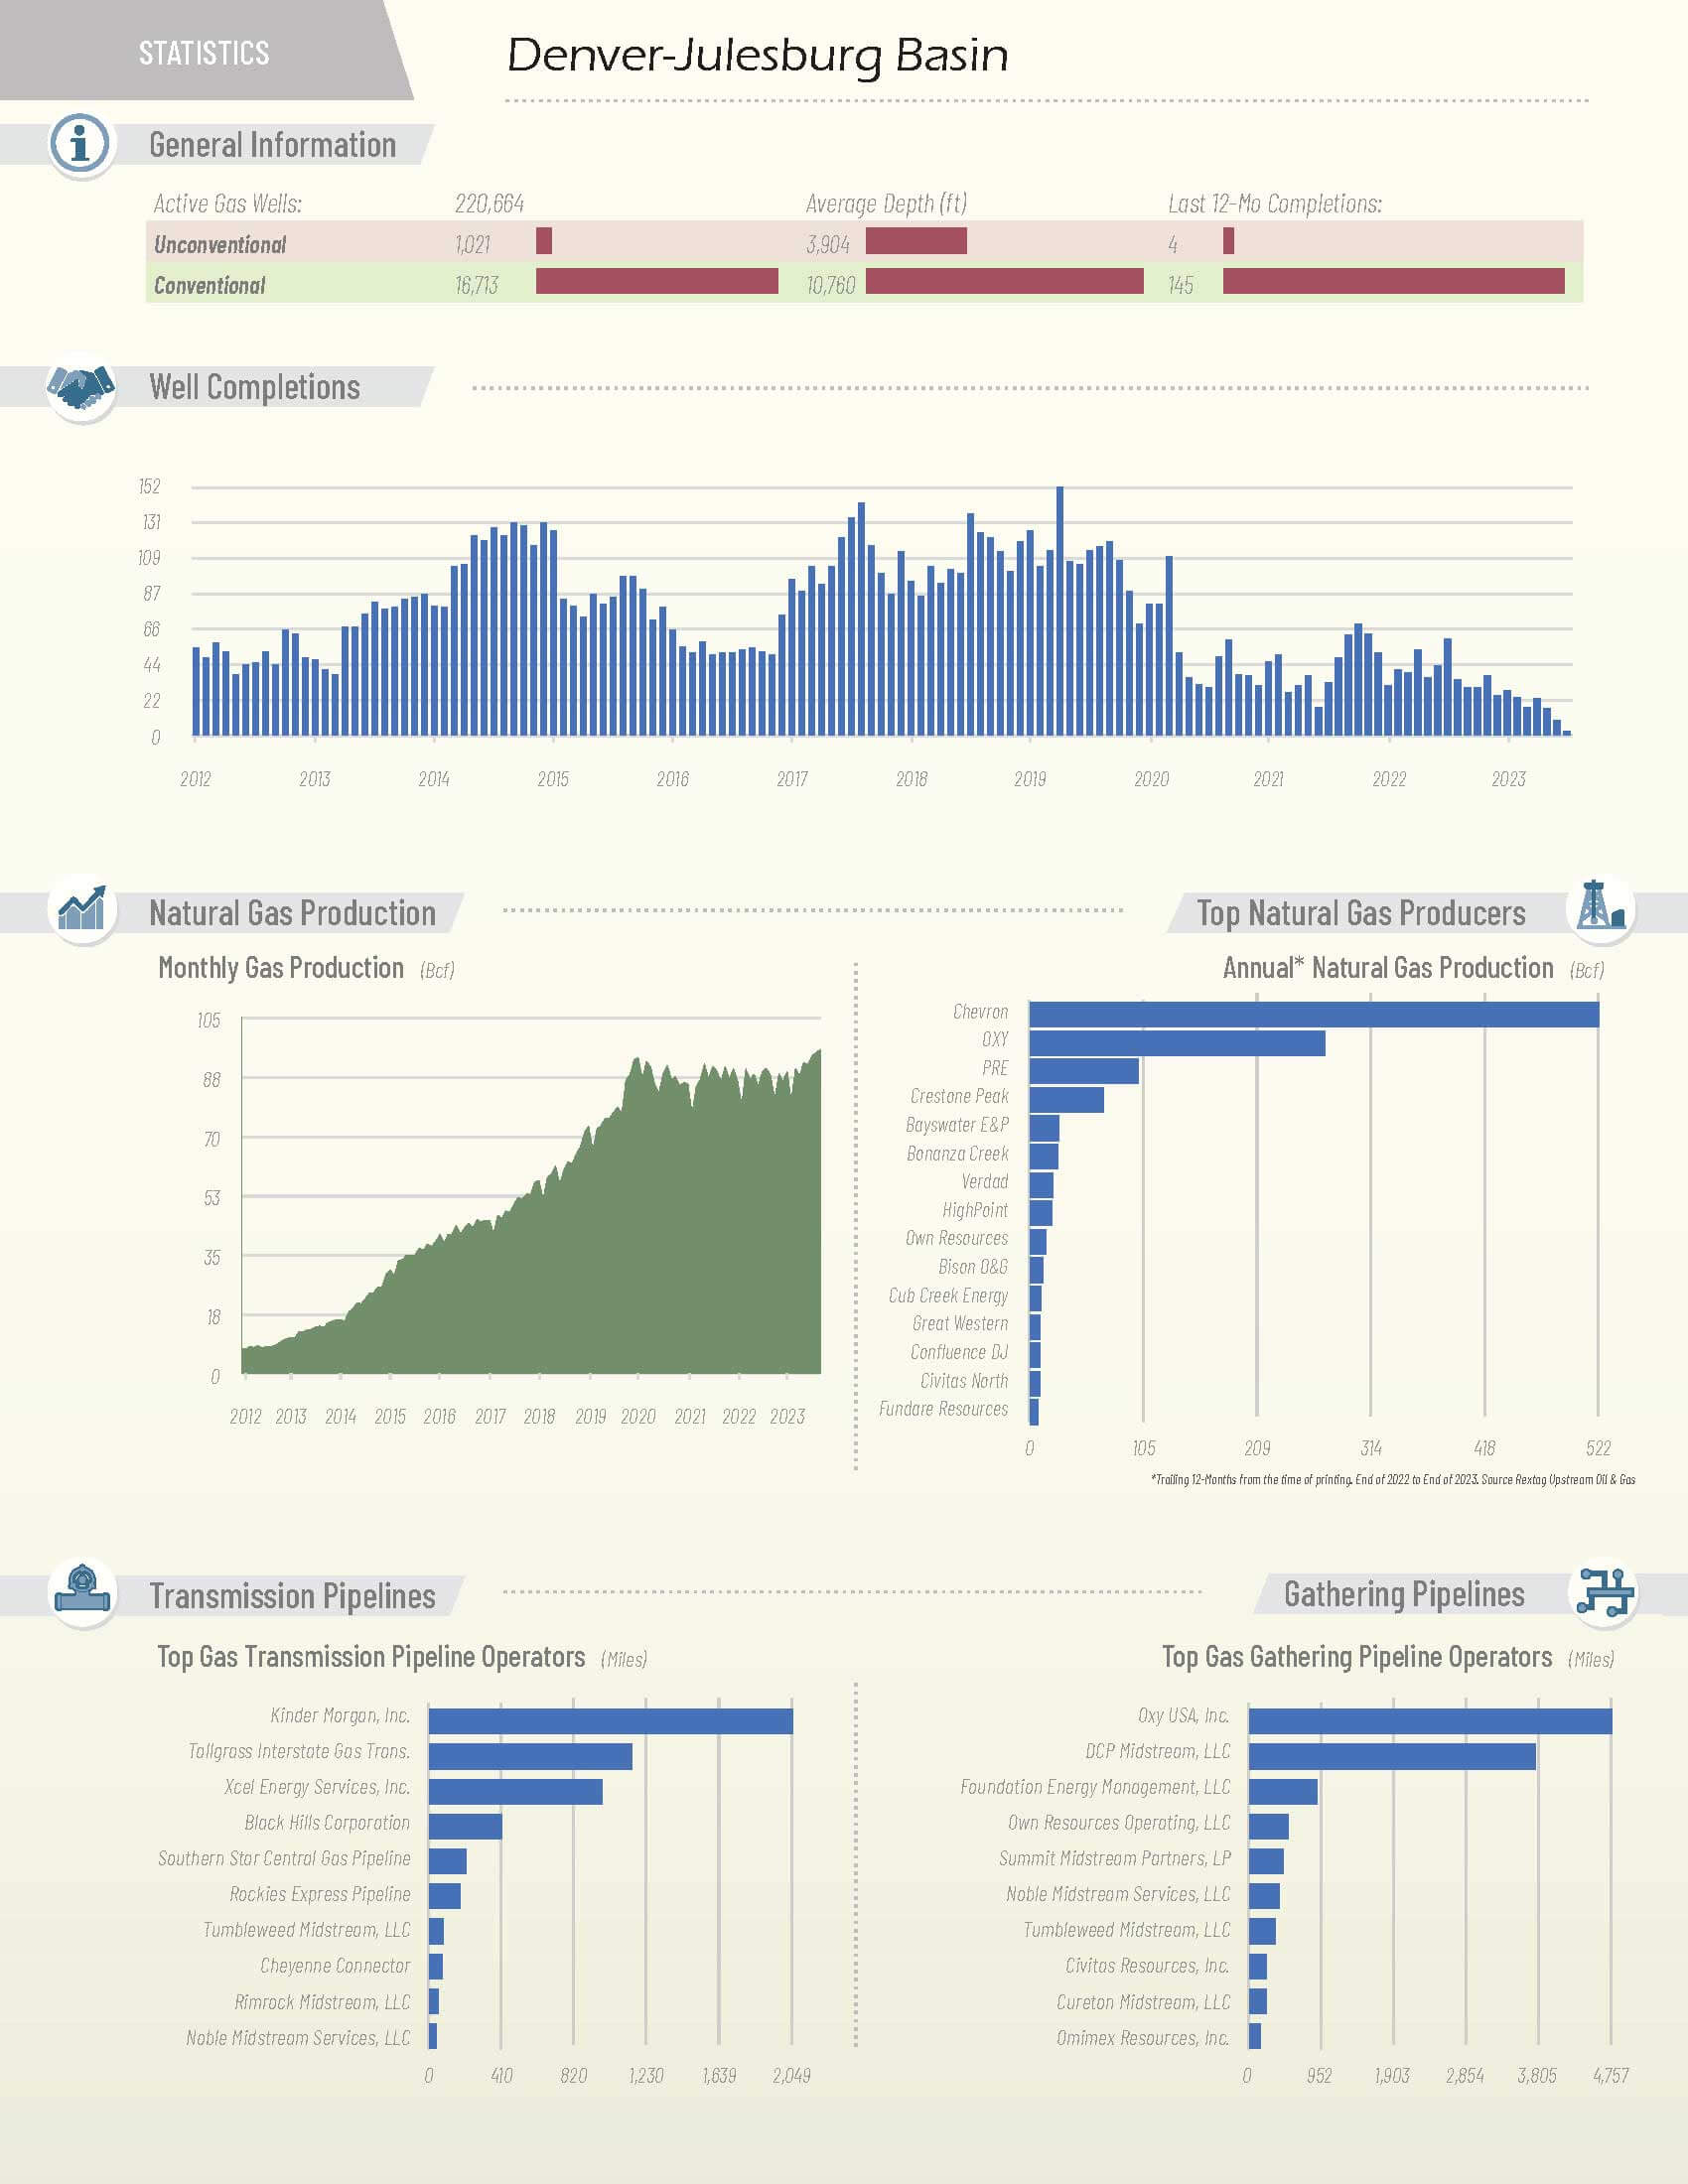
At Rextag, we meticulously collect and maintain databases encompassing the entire natural gas supply chain. Specifically, within the realm of natural gas, our coverage spans upstream gas well production through gathering systems, gas processing, transportation, LNG exports, and distribution. In this section, we initiate our coverage by examining the sources of natural gas in the United States. It's important to note that the selected basins in this analysis do not encompass all major oil and gas basins. Instead, we have chosen basins in the US based on the total annual gas production within them. Additionally, our definition of basin outlines differs somewhat from others, including the EIA. We define basin outlines based on logical groupings, the location of active producing wells, and the colloquial industry understanding of regions. However, the inclusion of the high-producing volume of the basin cores aligns with other entities defining these outlines, resulting in very similar production volumes in the end, as outliers contribute marginal volumes to the overall basin production.
Natural Gas Midstream Gathering
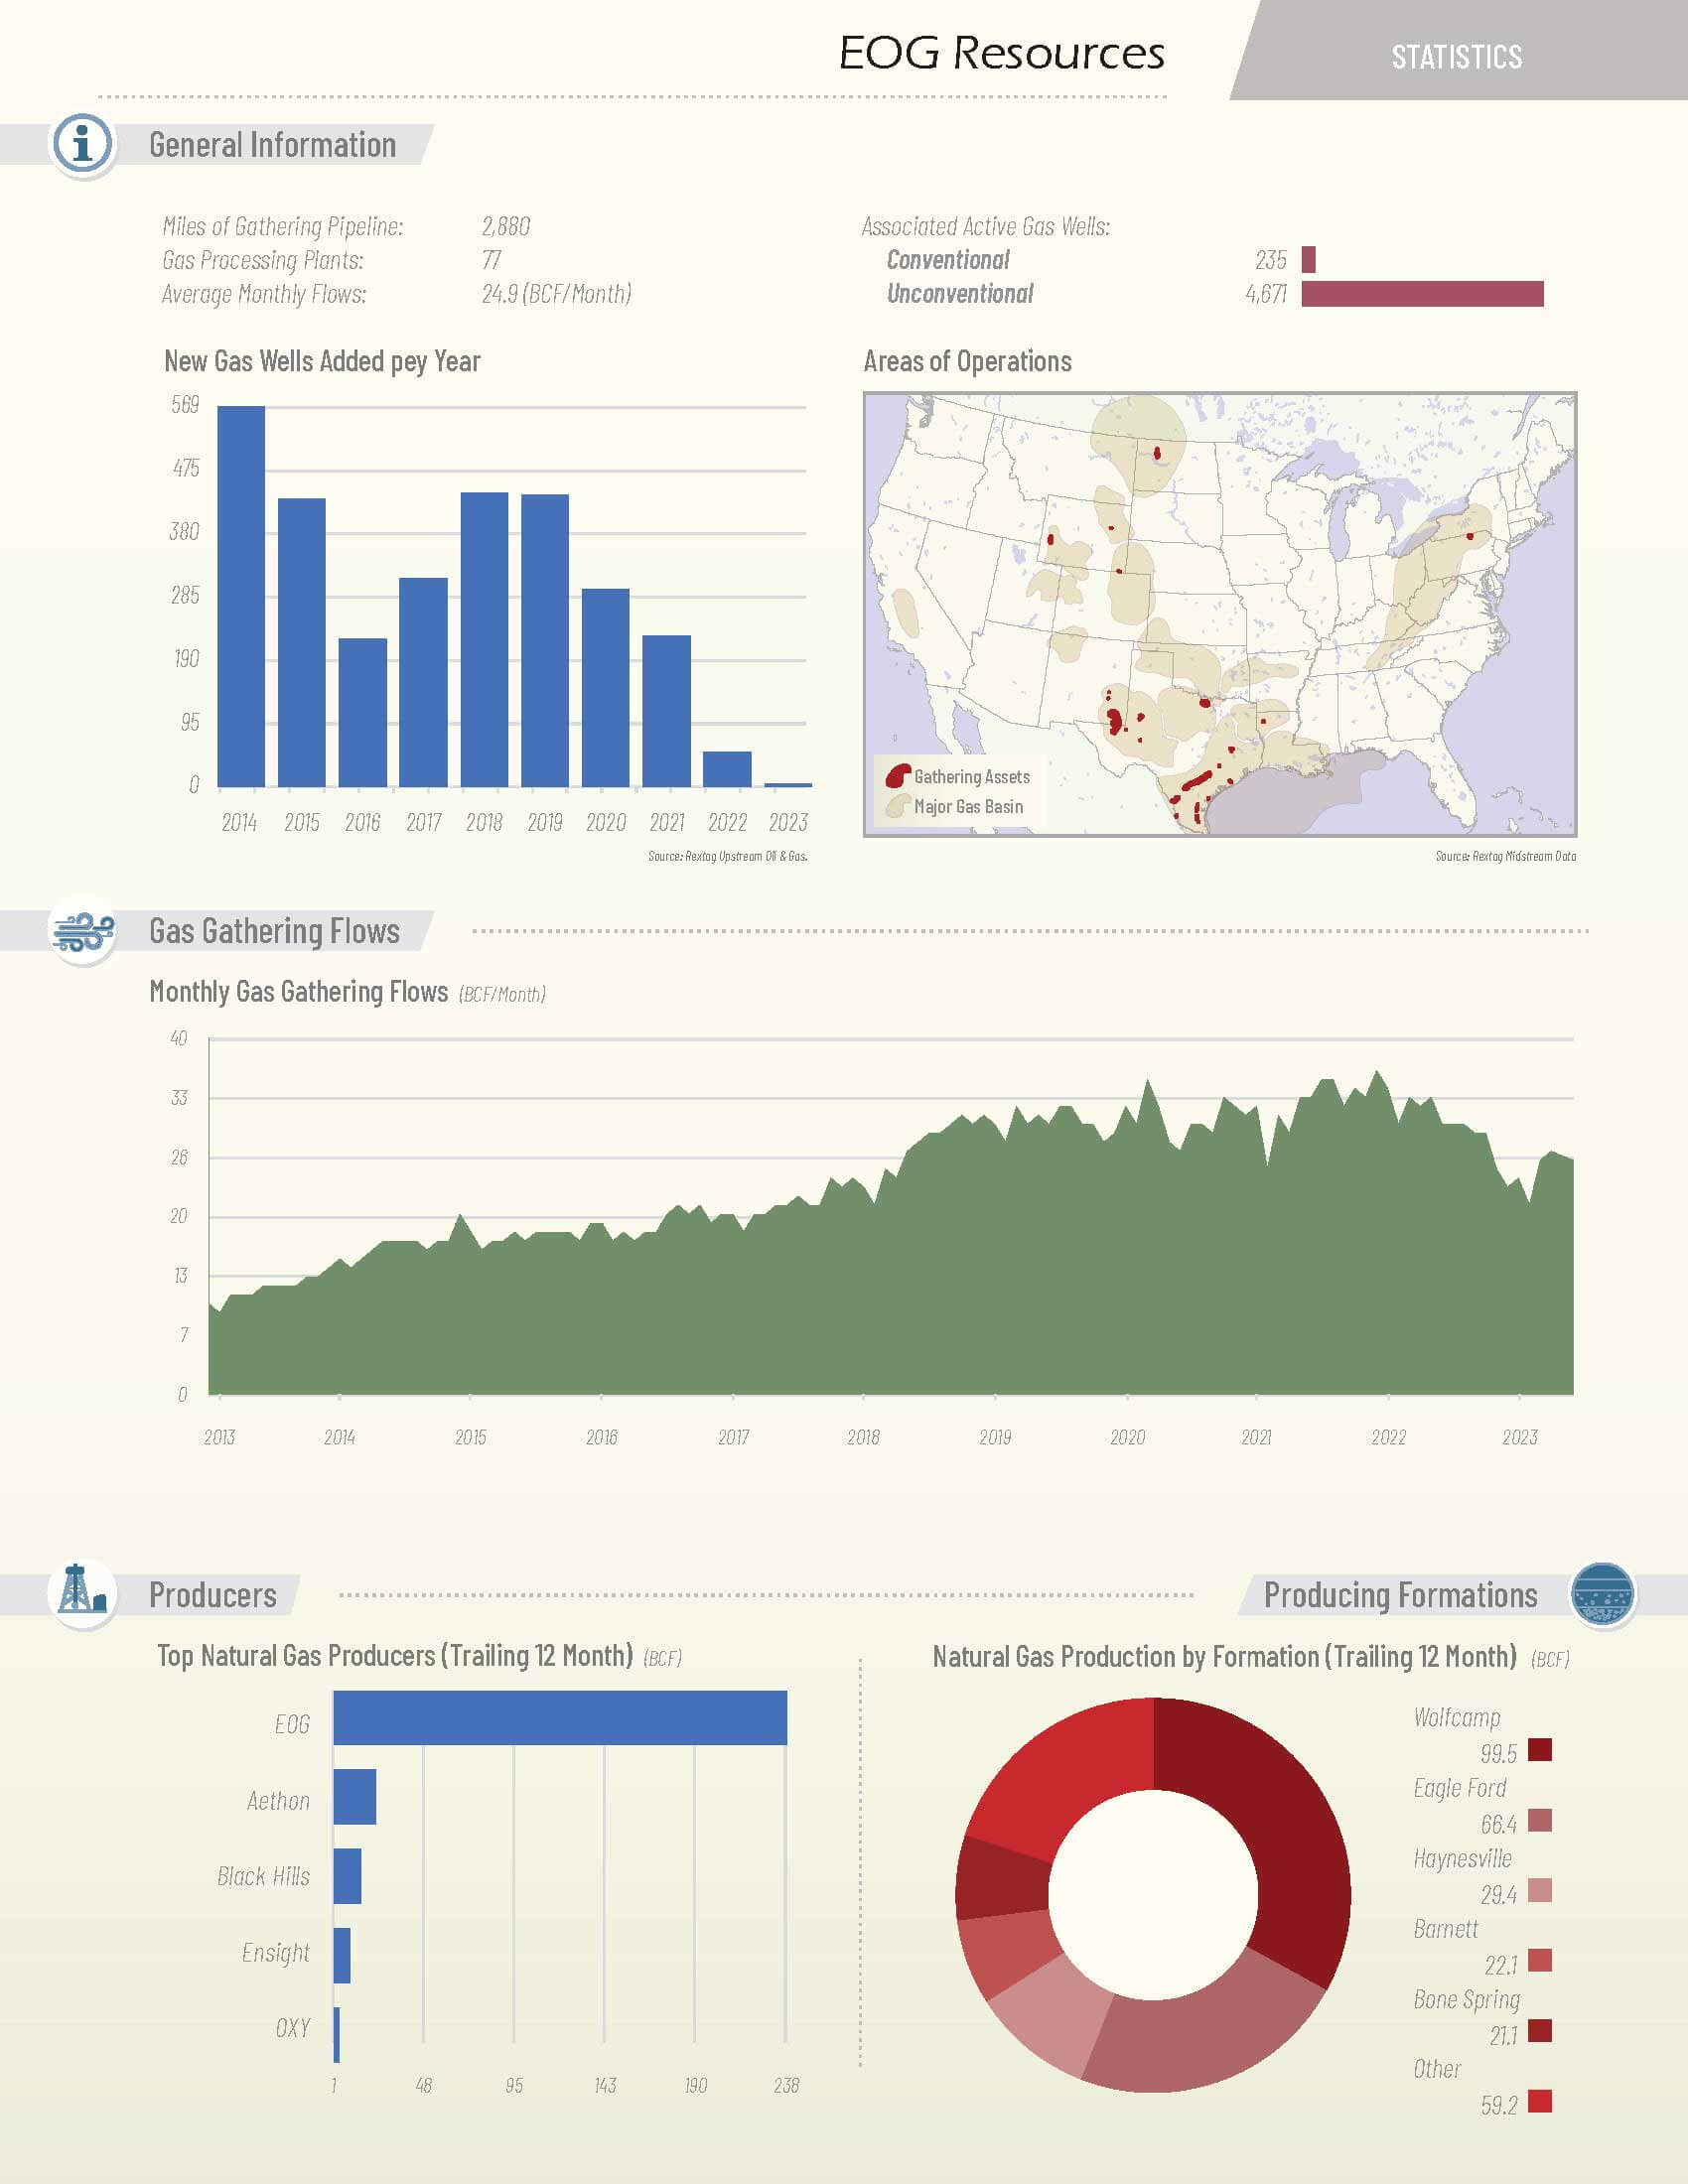
Rextag diligently collects energy infrastructure data across the entire energy supply chain, spanning from the largest midstream companies to the smallest assets, including single-field facilities or assets composed of a single 10-foot long pipeline. Our overarching goal is to comprehensively cover 100% of the infrastructure involved in the production, processing, transportation, and delivery of energy.
For this book, our focus is on the largest midstream companies, particularly honing in on their assets and activities related to natural gas gathering. The methodology employed in ranking and selecting these midstream companies relies on known gas production from wells connected to their systems, drawing upon extensive research conducted by the Rextag data team over the past years. While the production and, consequently, "transportation" volumes attributed to these companies in this section are not exhaustive, they provide a very close estimation of the volumes handled by the midstream company as a whole. This data serves to visually depict the coverage and impact that these midstream companies have on the natural gas midstream sector, along with historical trends in gathering flows.
Natural Gas Processing Plants
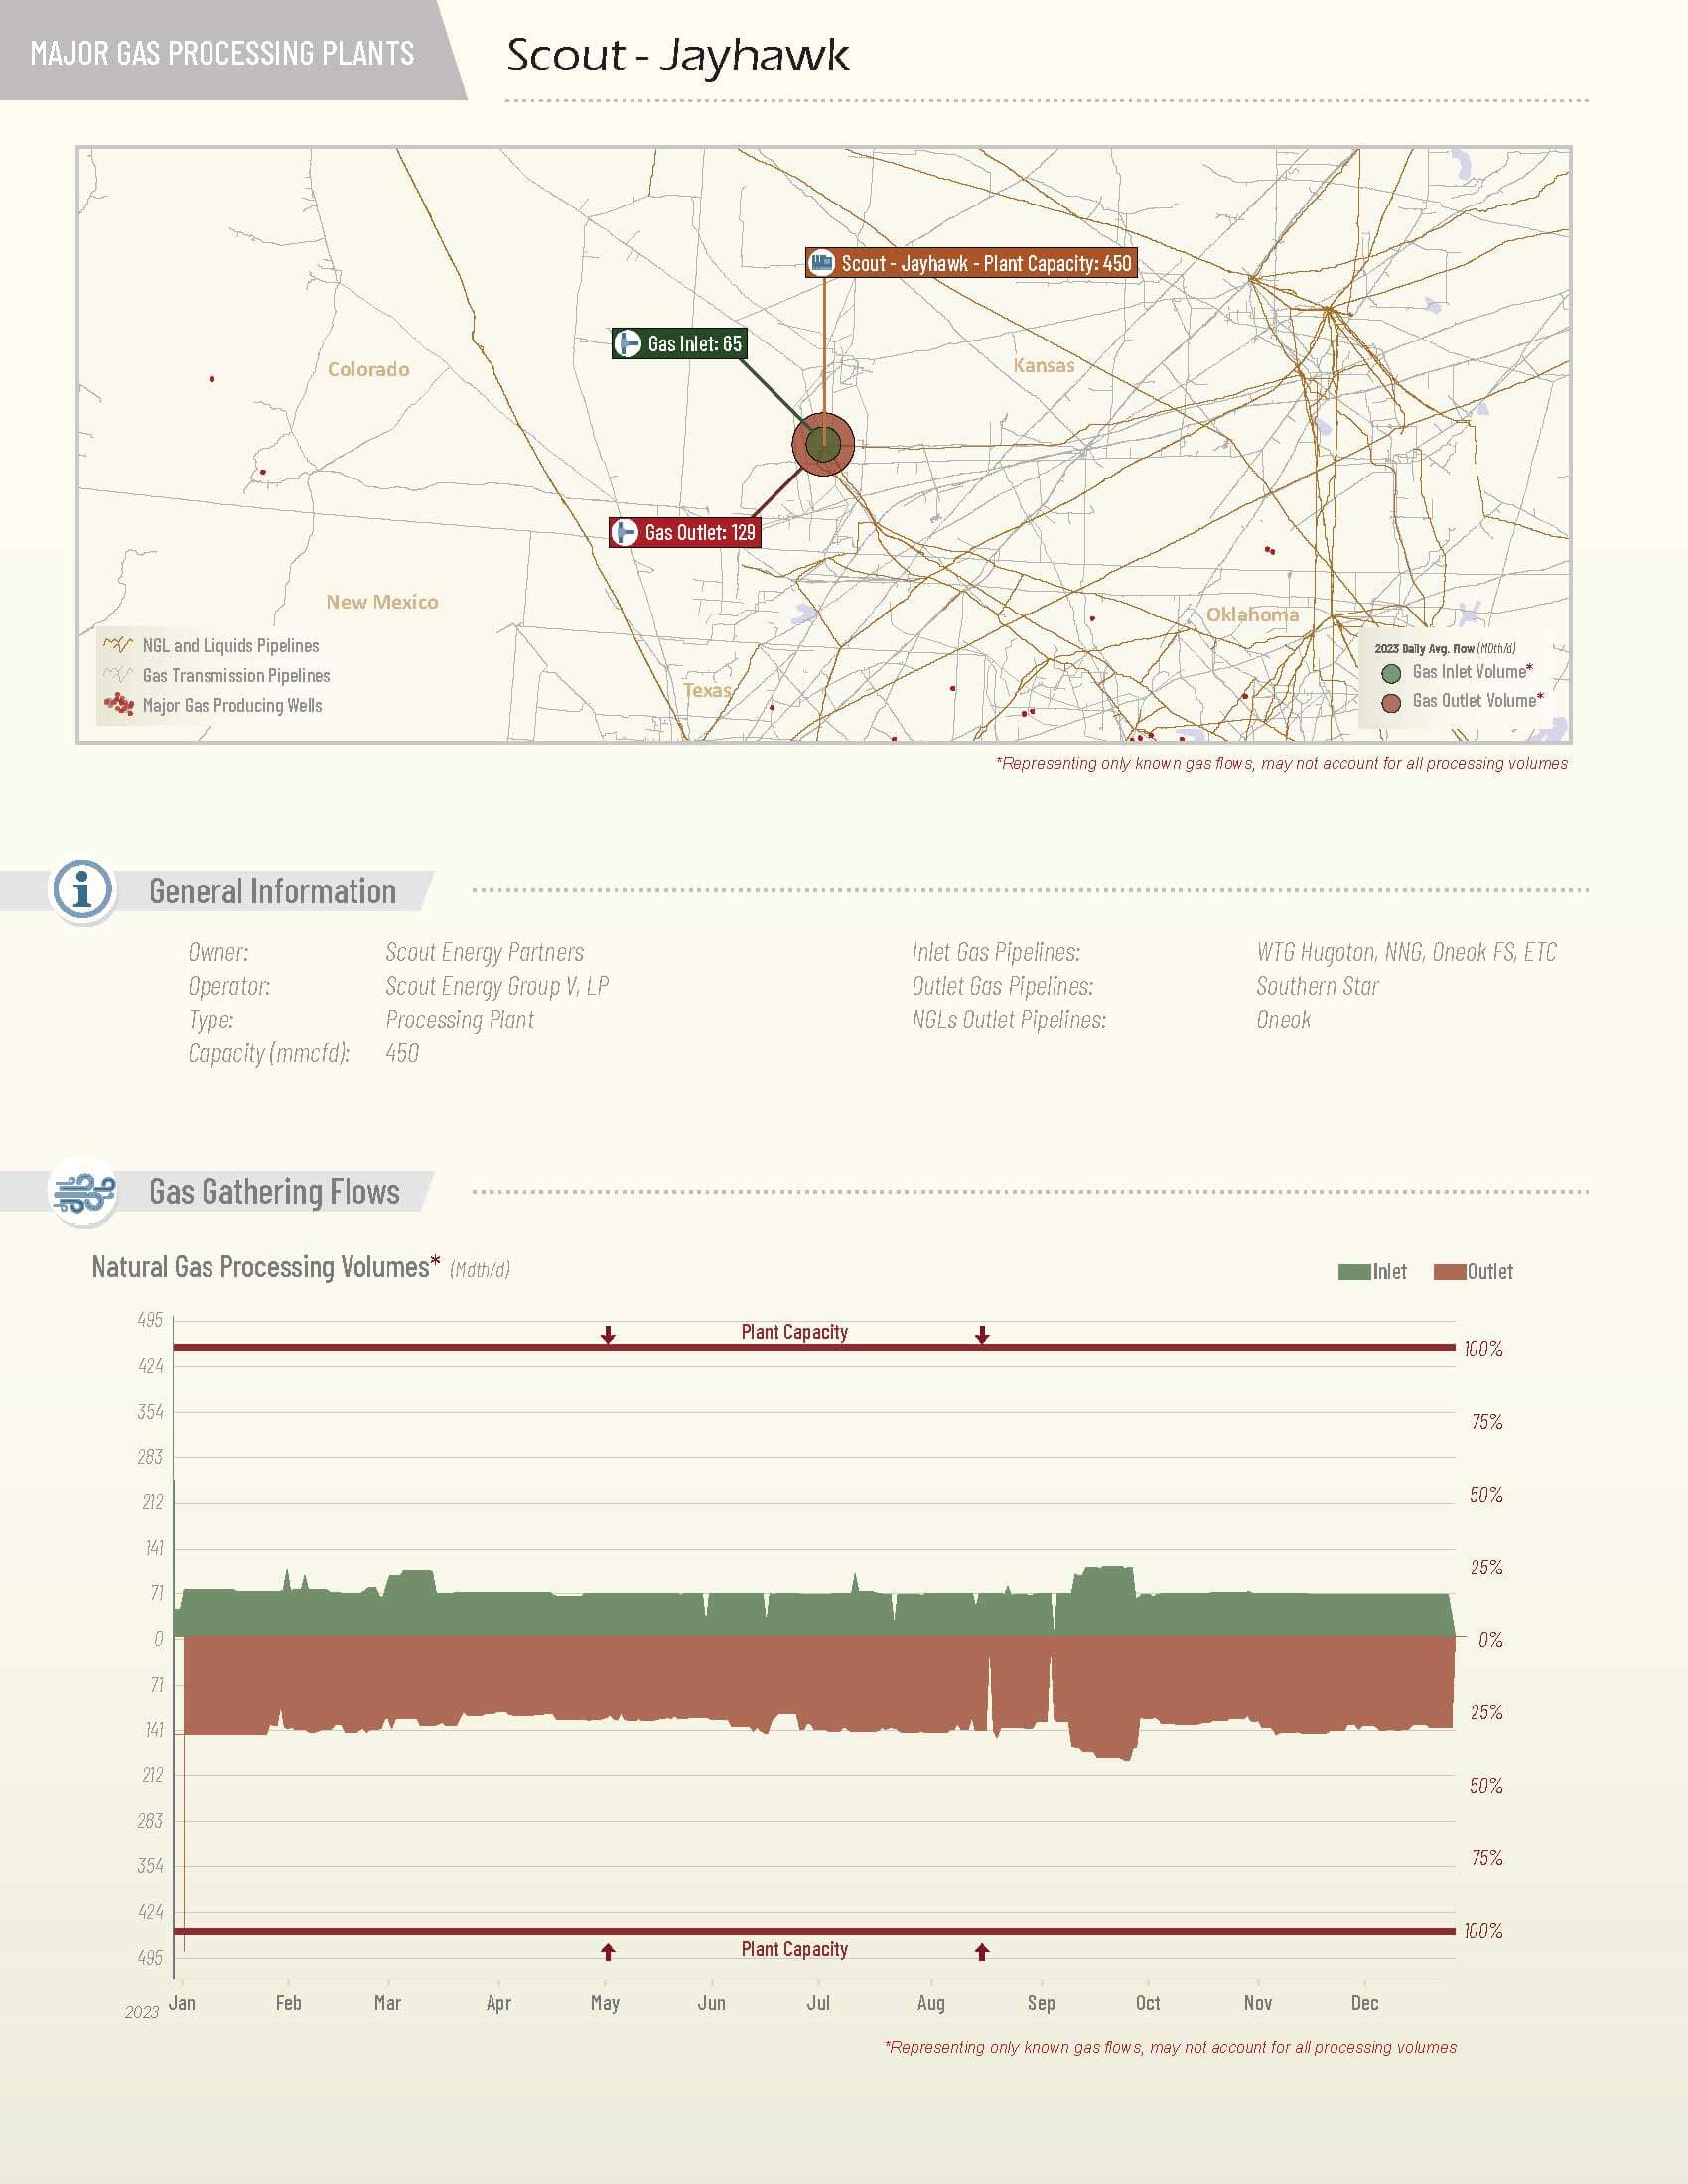
Flow data for gas plants is not universally available or reported. However, most major gas processing plants have one or more interconnections with federally-regulated interstate assets, and therefore, data is accessible for those meter points. This information can be used to provide insights into the plant's activities and operations. It's important to note that in certain situations, plants may feature a combination of regulated and non-regulated meter points, and flow data derived solely from regulated points may offer an incomplete report. In this section, we have specifically chosen some of the major gas plants in the United States that play a crucial role in processing a significant portion of the produced gas.
Interstate Natural Gas Pipelines & Storage Facilities
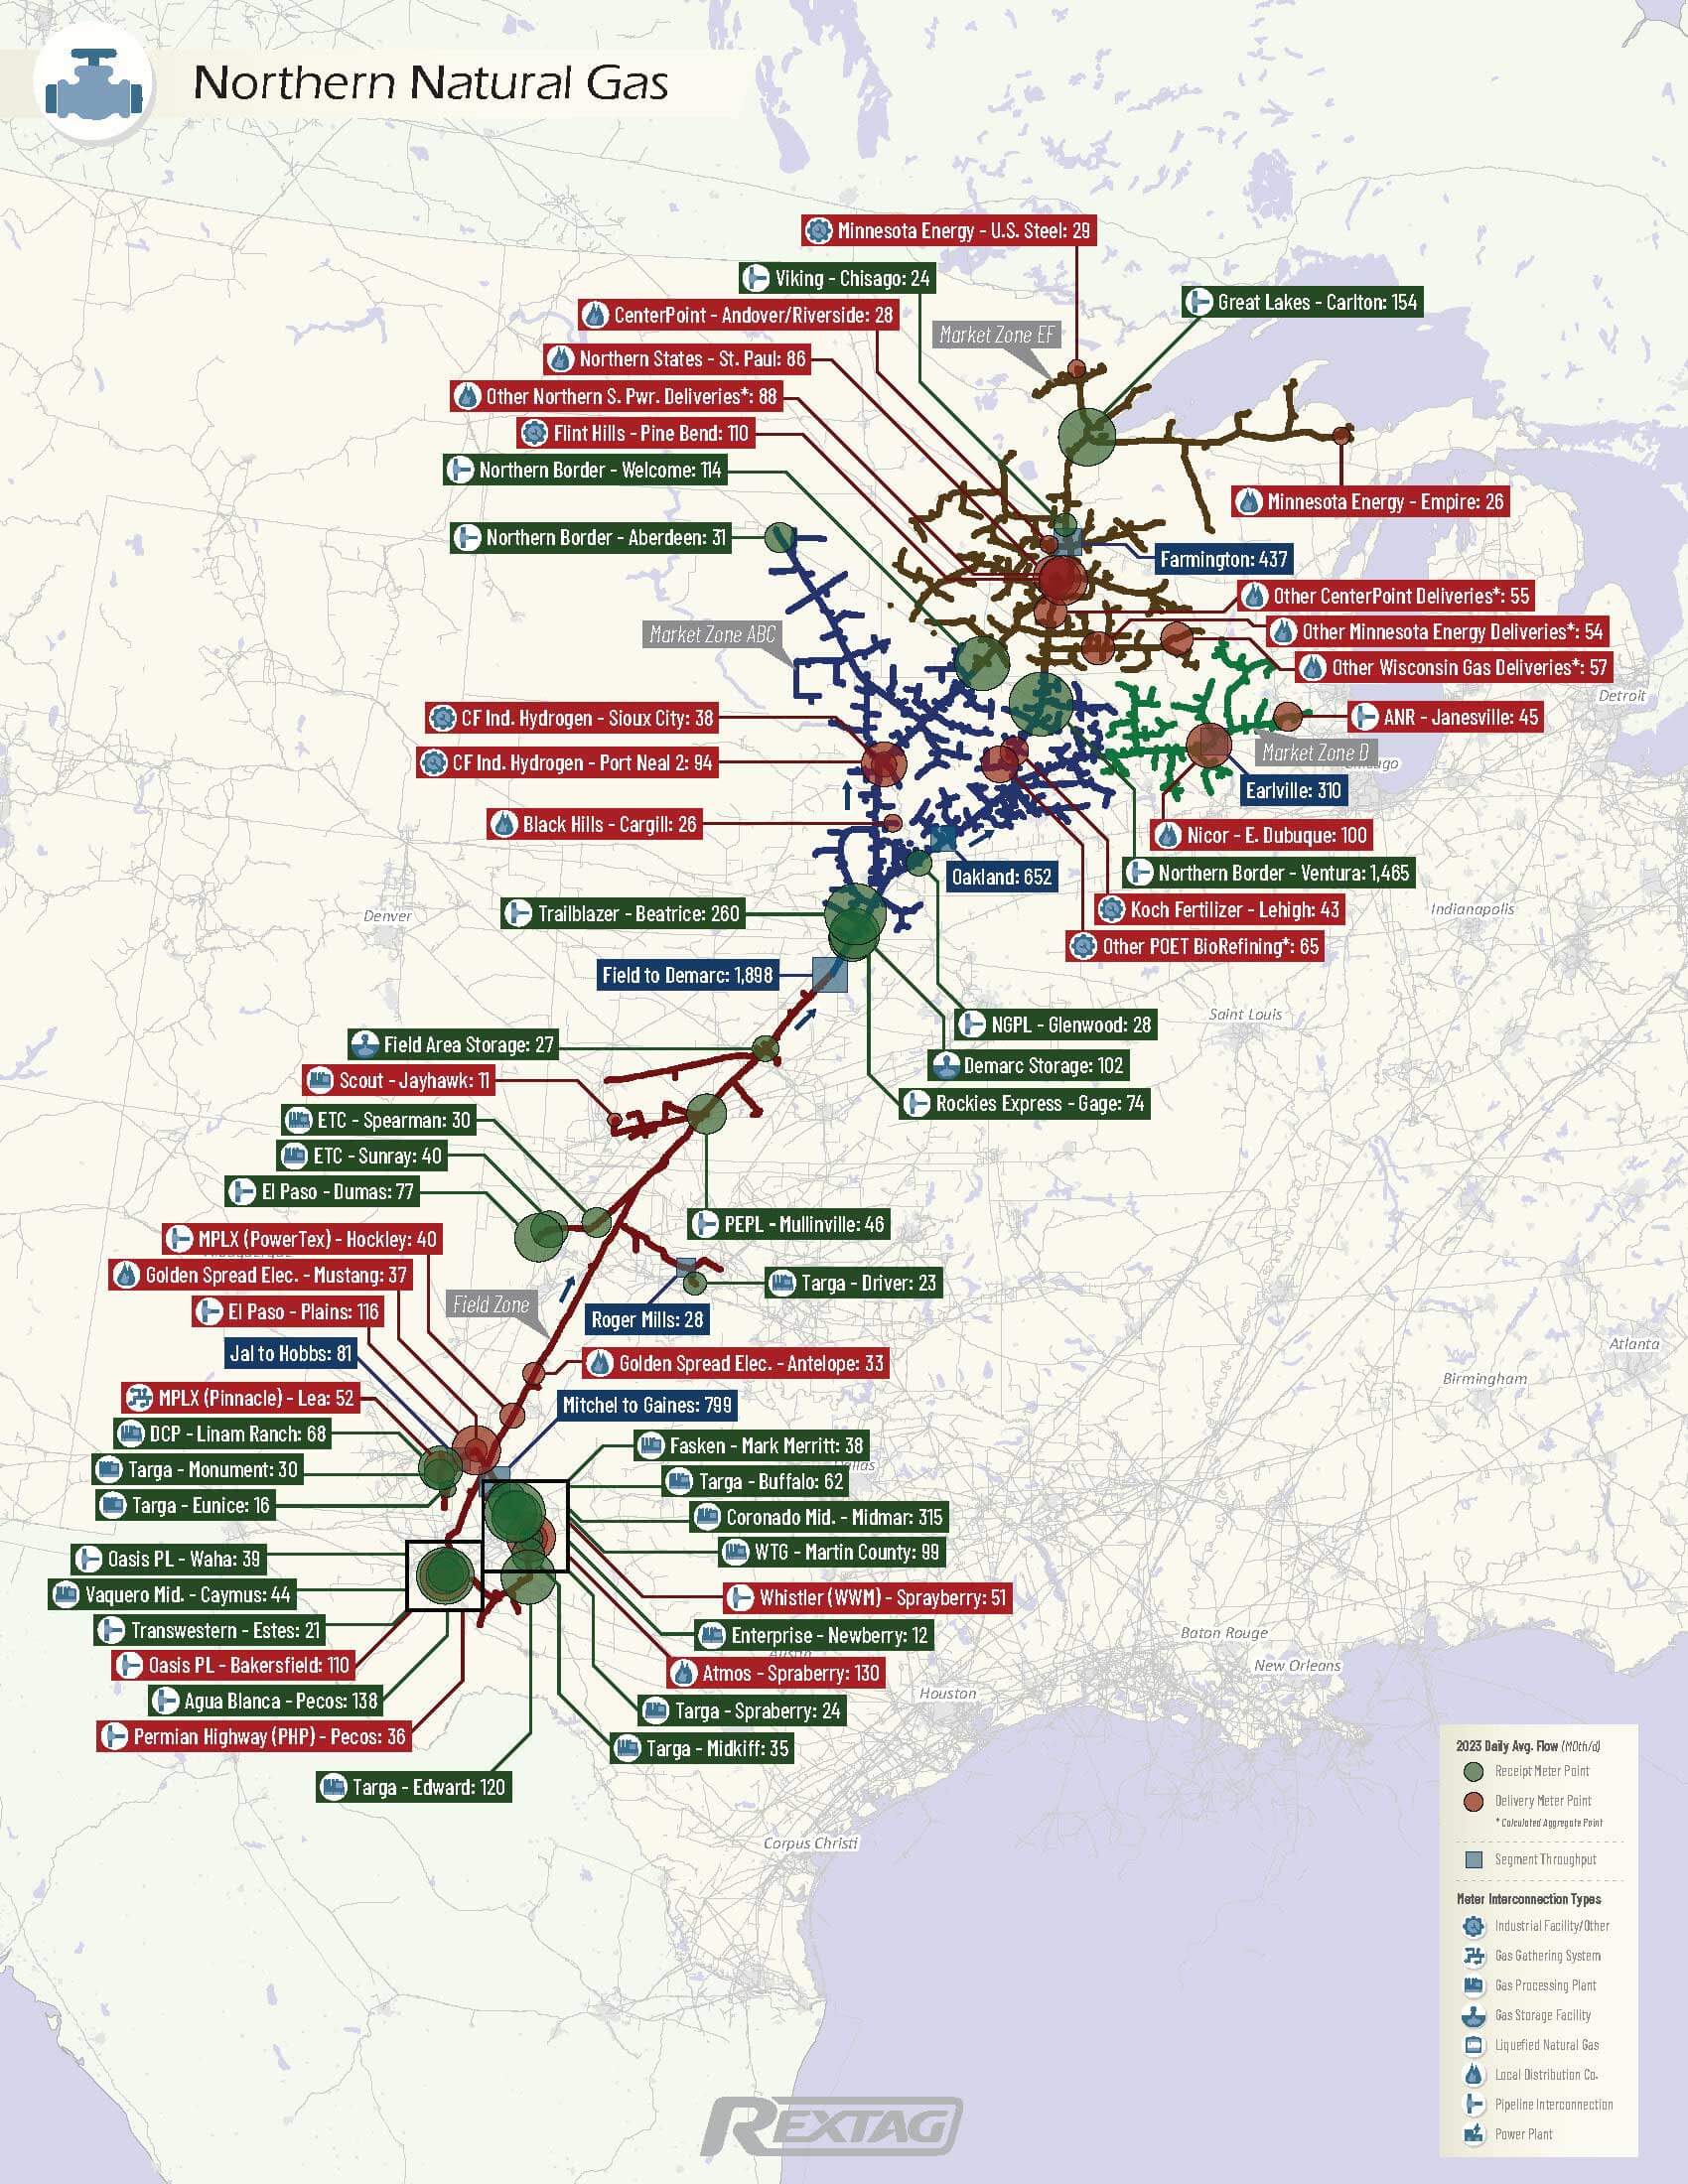
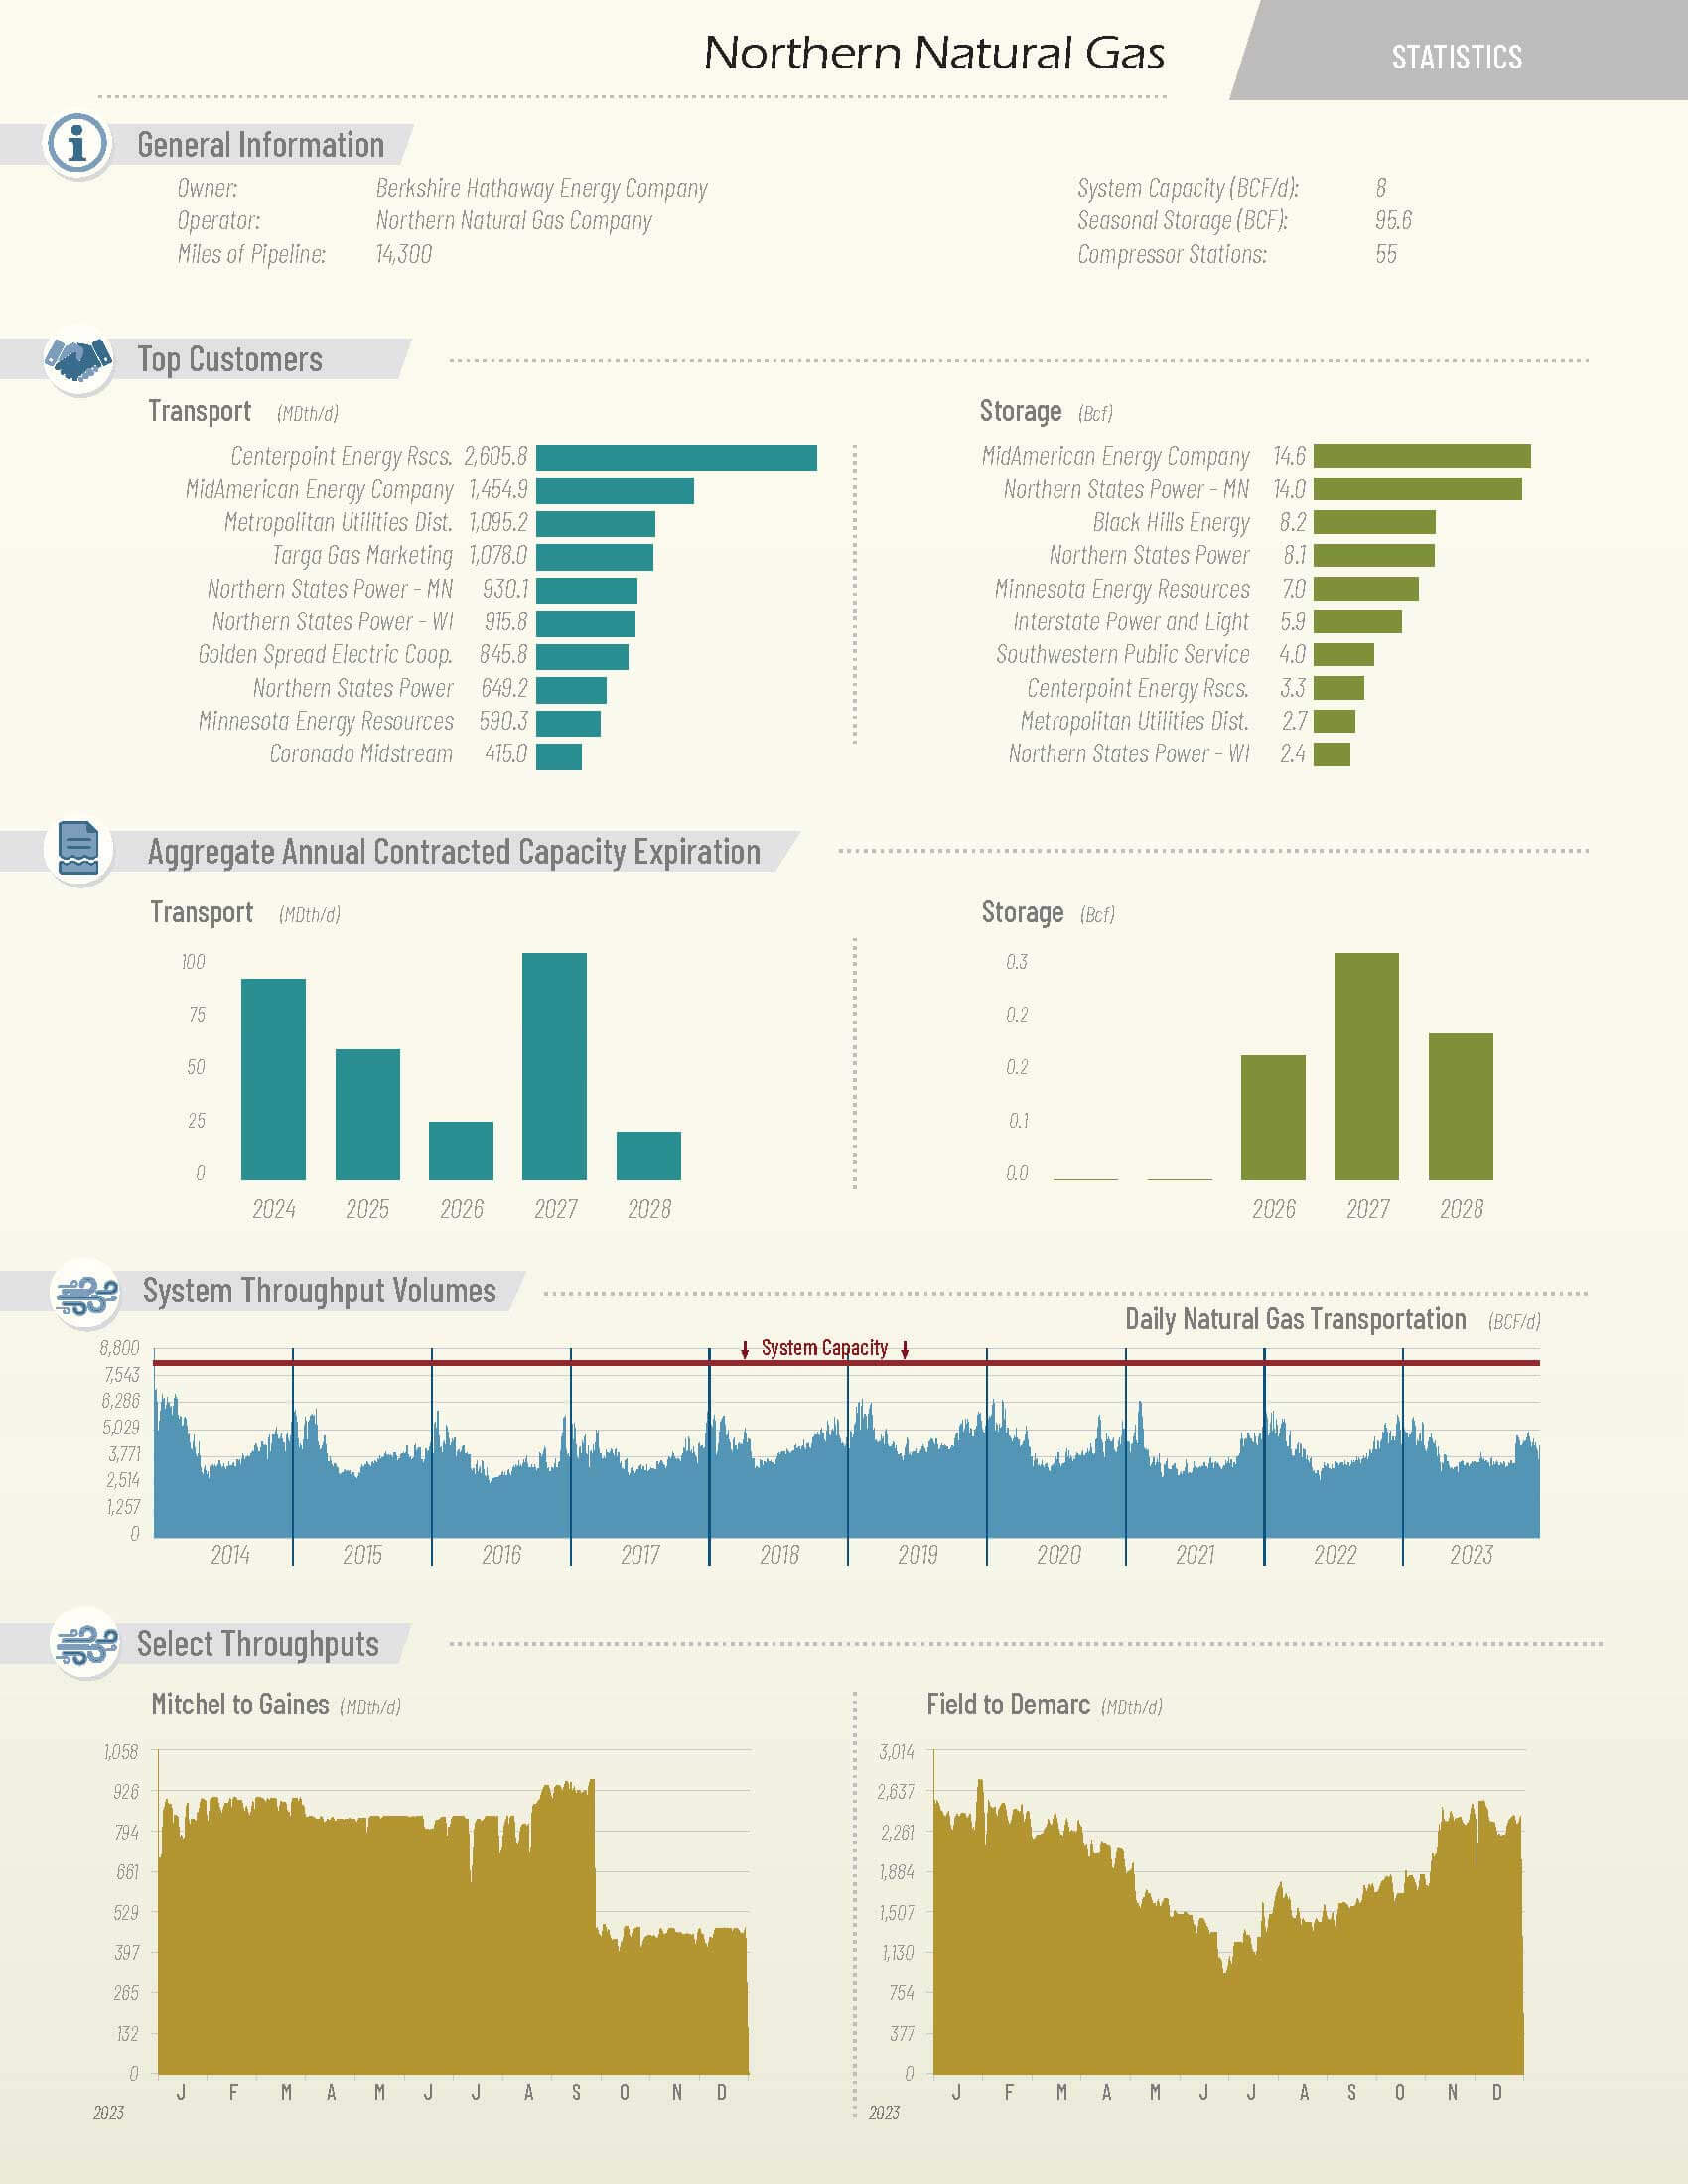
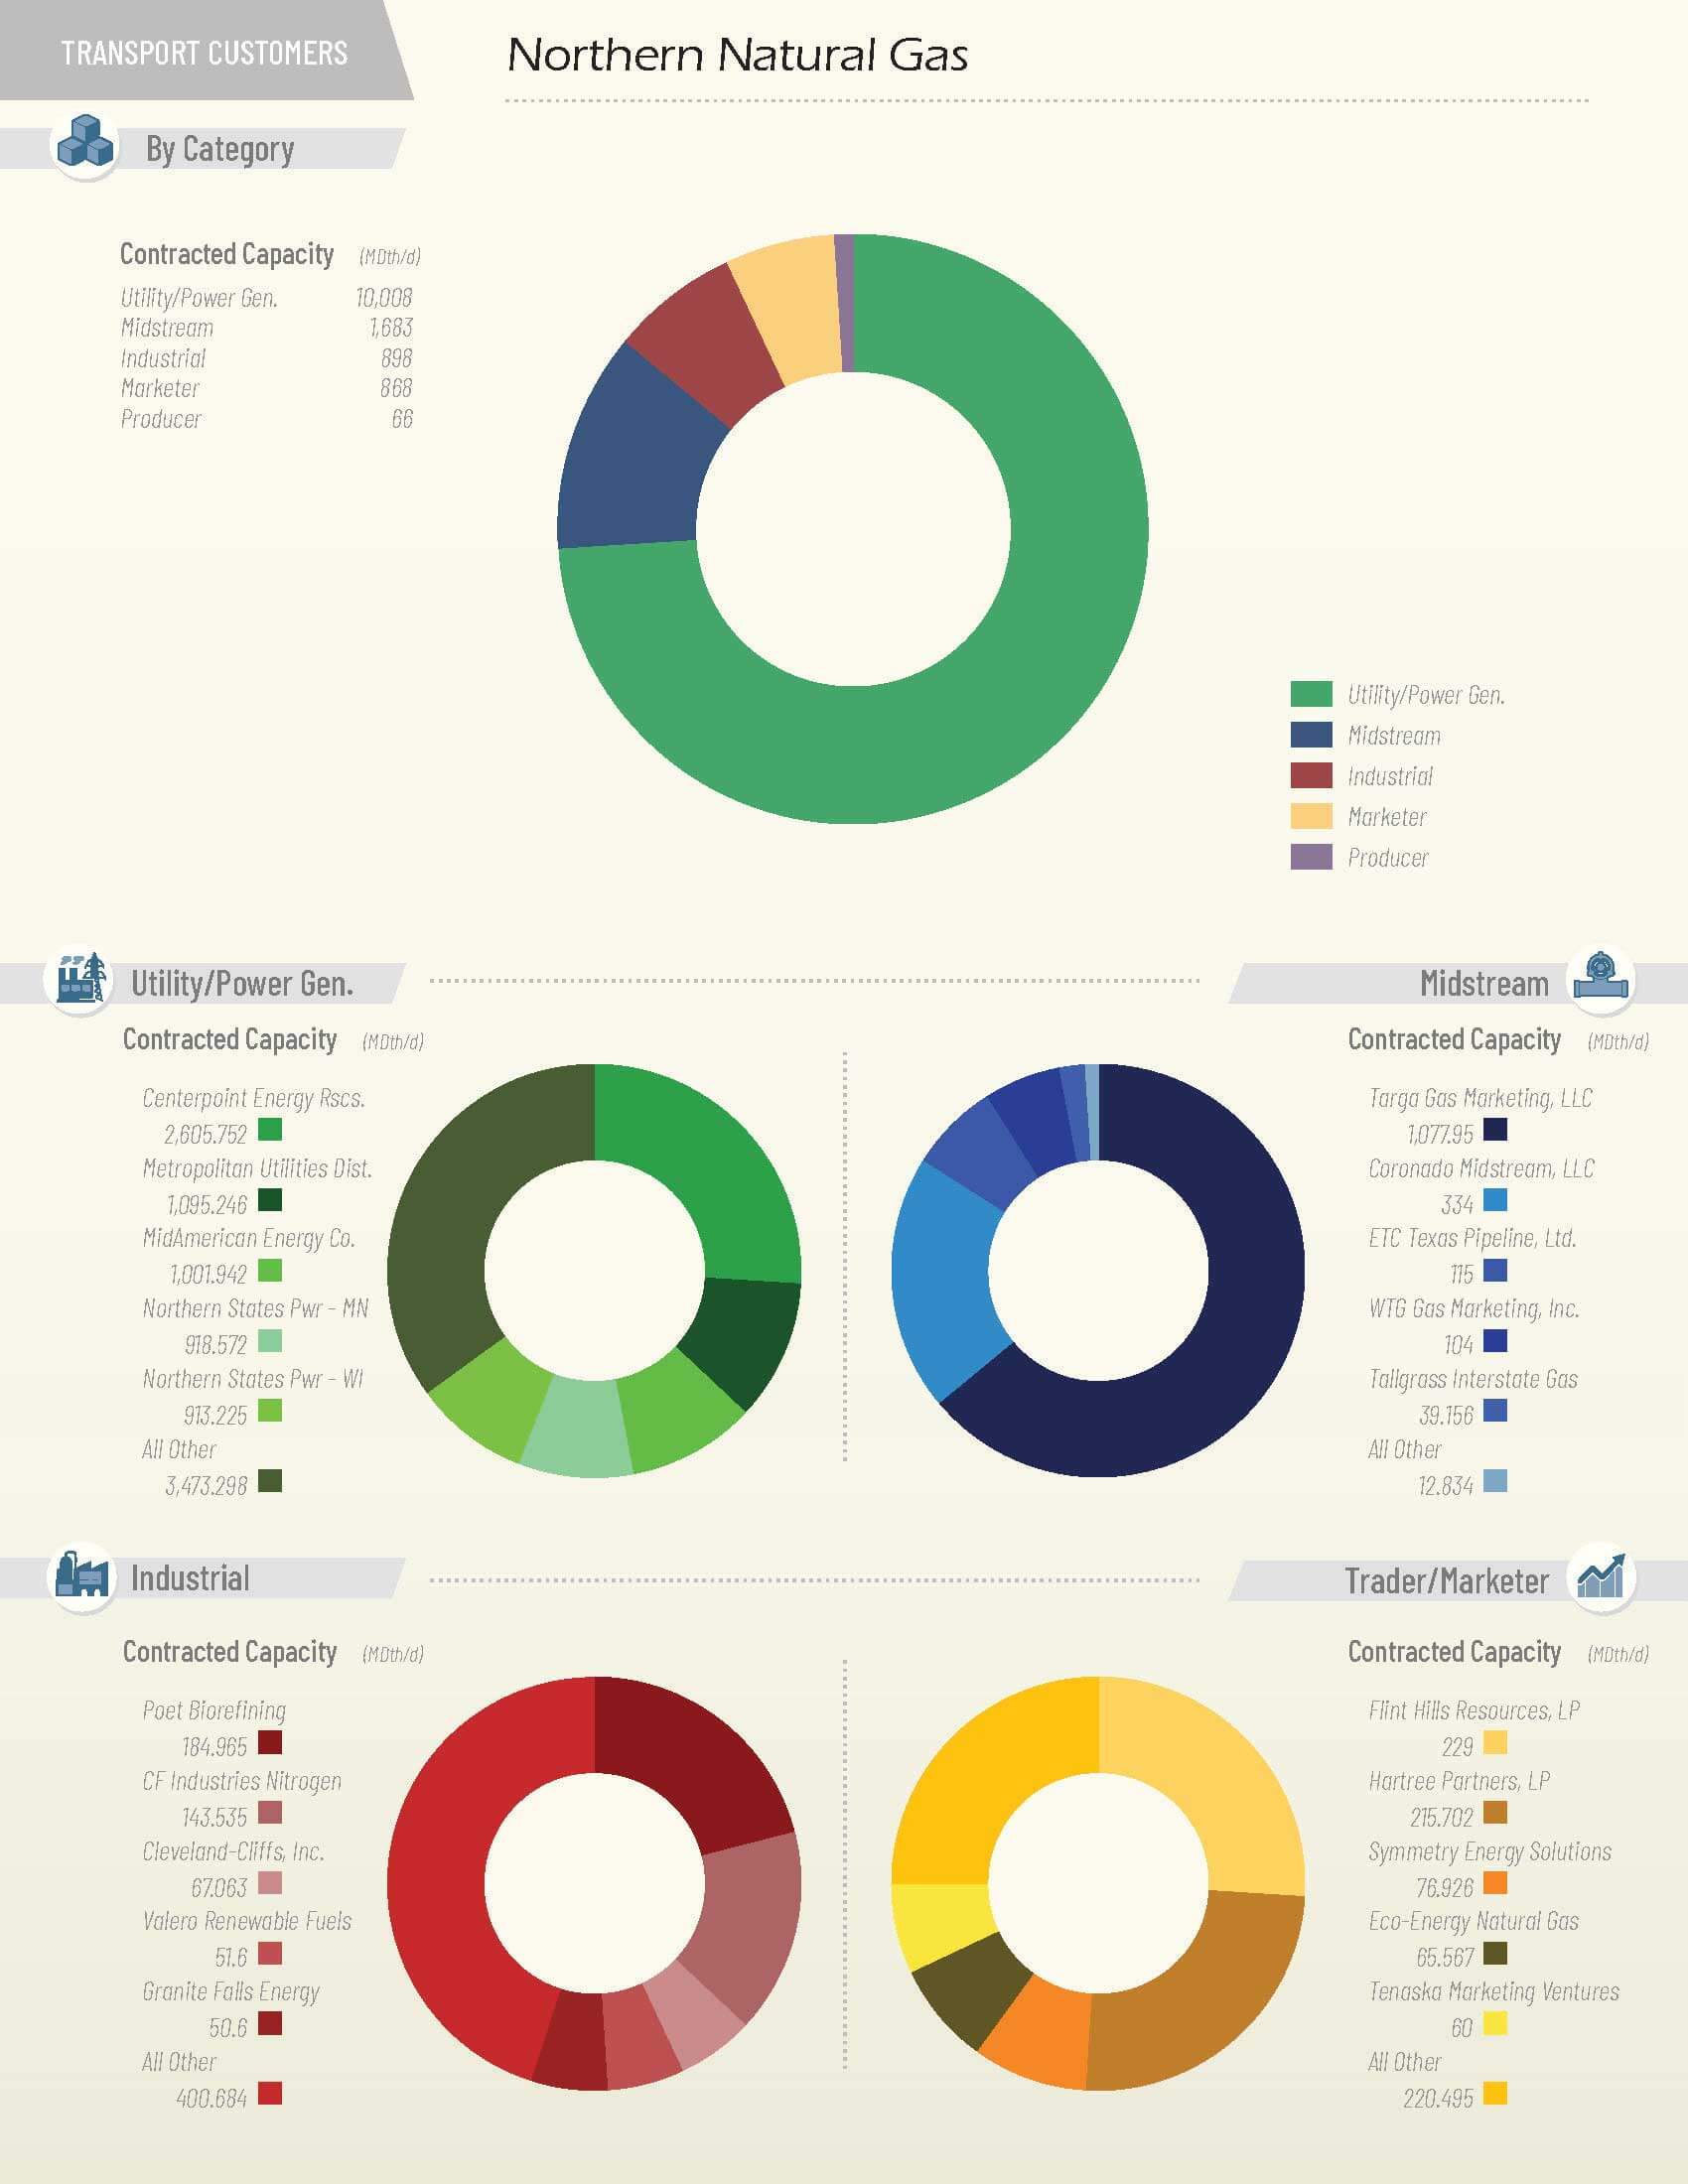
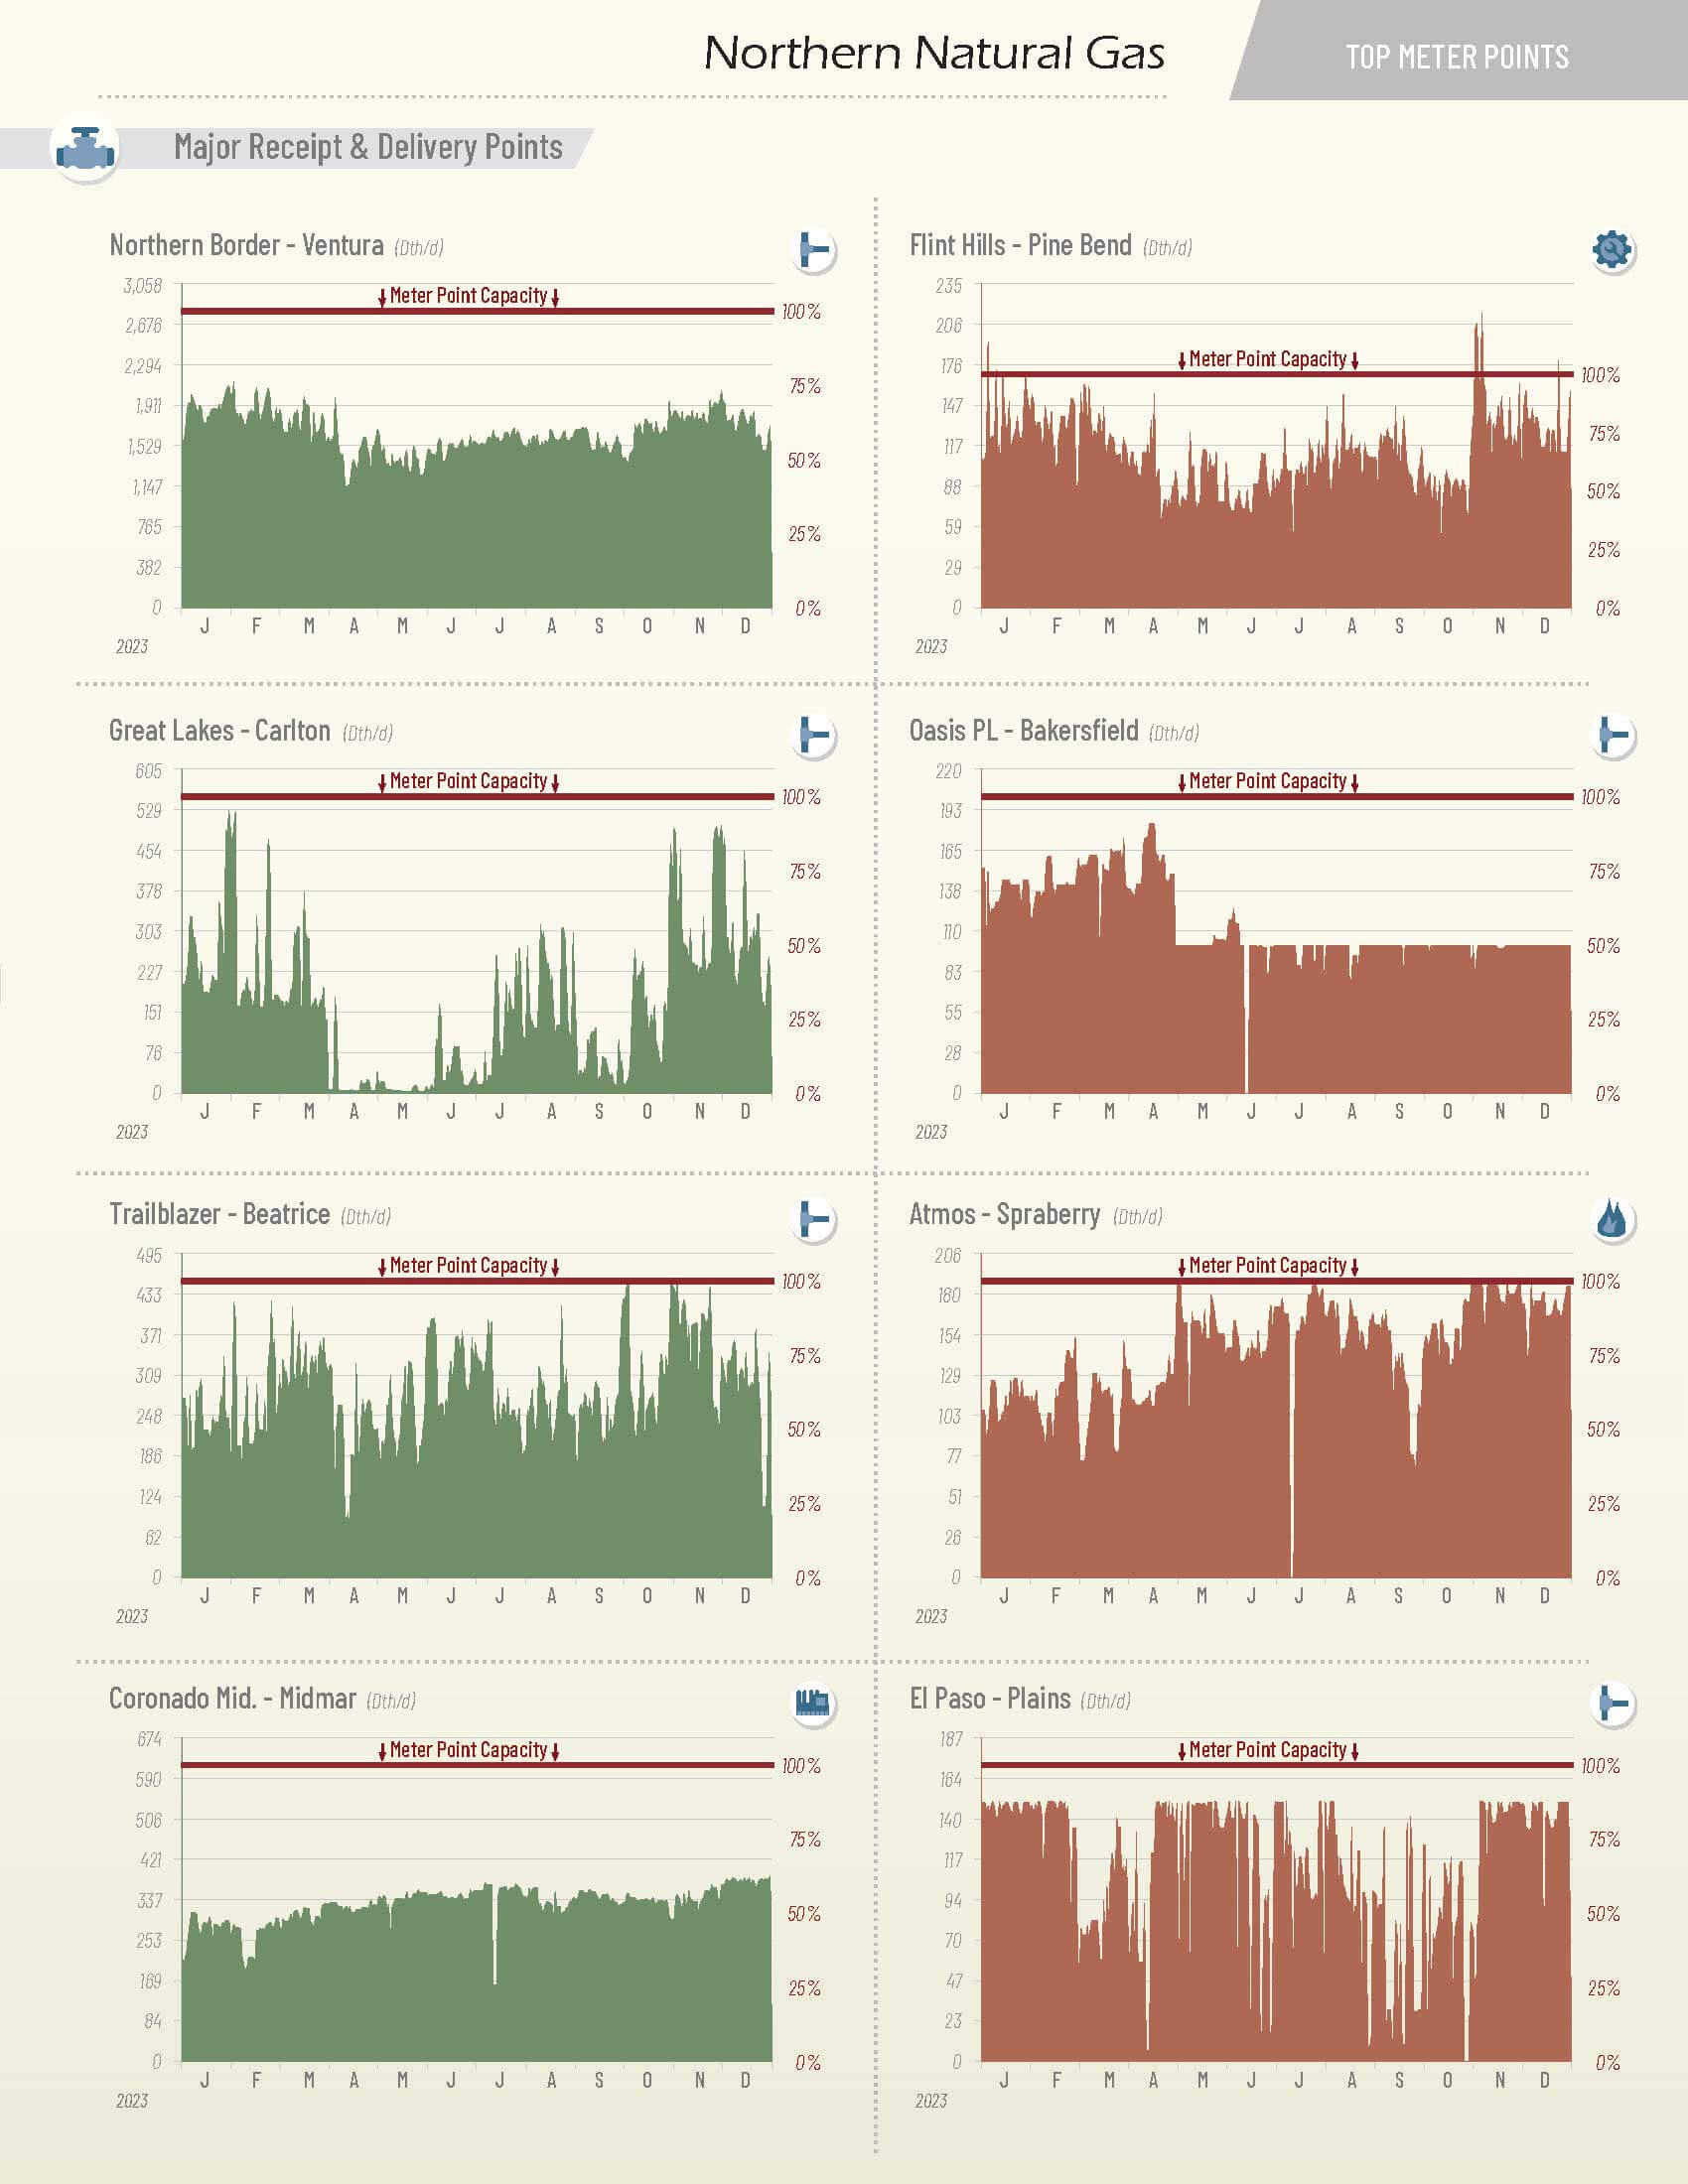
Assets included in this section are those falling under the jurisdiction of the US Federal Energy Regulatory Commission (FERC), having involvement in the transportation of natural gas across state borders or otherwise directly supporting this commerce, such as smaller systems that do not cross state lines. These assets are designated as regulated Interstate assets. An evident advantage of interstate assets, in terms of data transparency, lies in the readily available wealth of data, which we heavily rely on in the development of maps and data for this section. While we have made every effort to include all regulated assets in this section, some very small assets or those small enough to be exempt from filing might not be included here. It's important to note that any asset not included would represent extremely negligible volumes of natural gas when compared to the overall gas transportation in the US.
Intrastate Natural Gas Pipelines
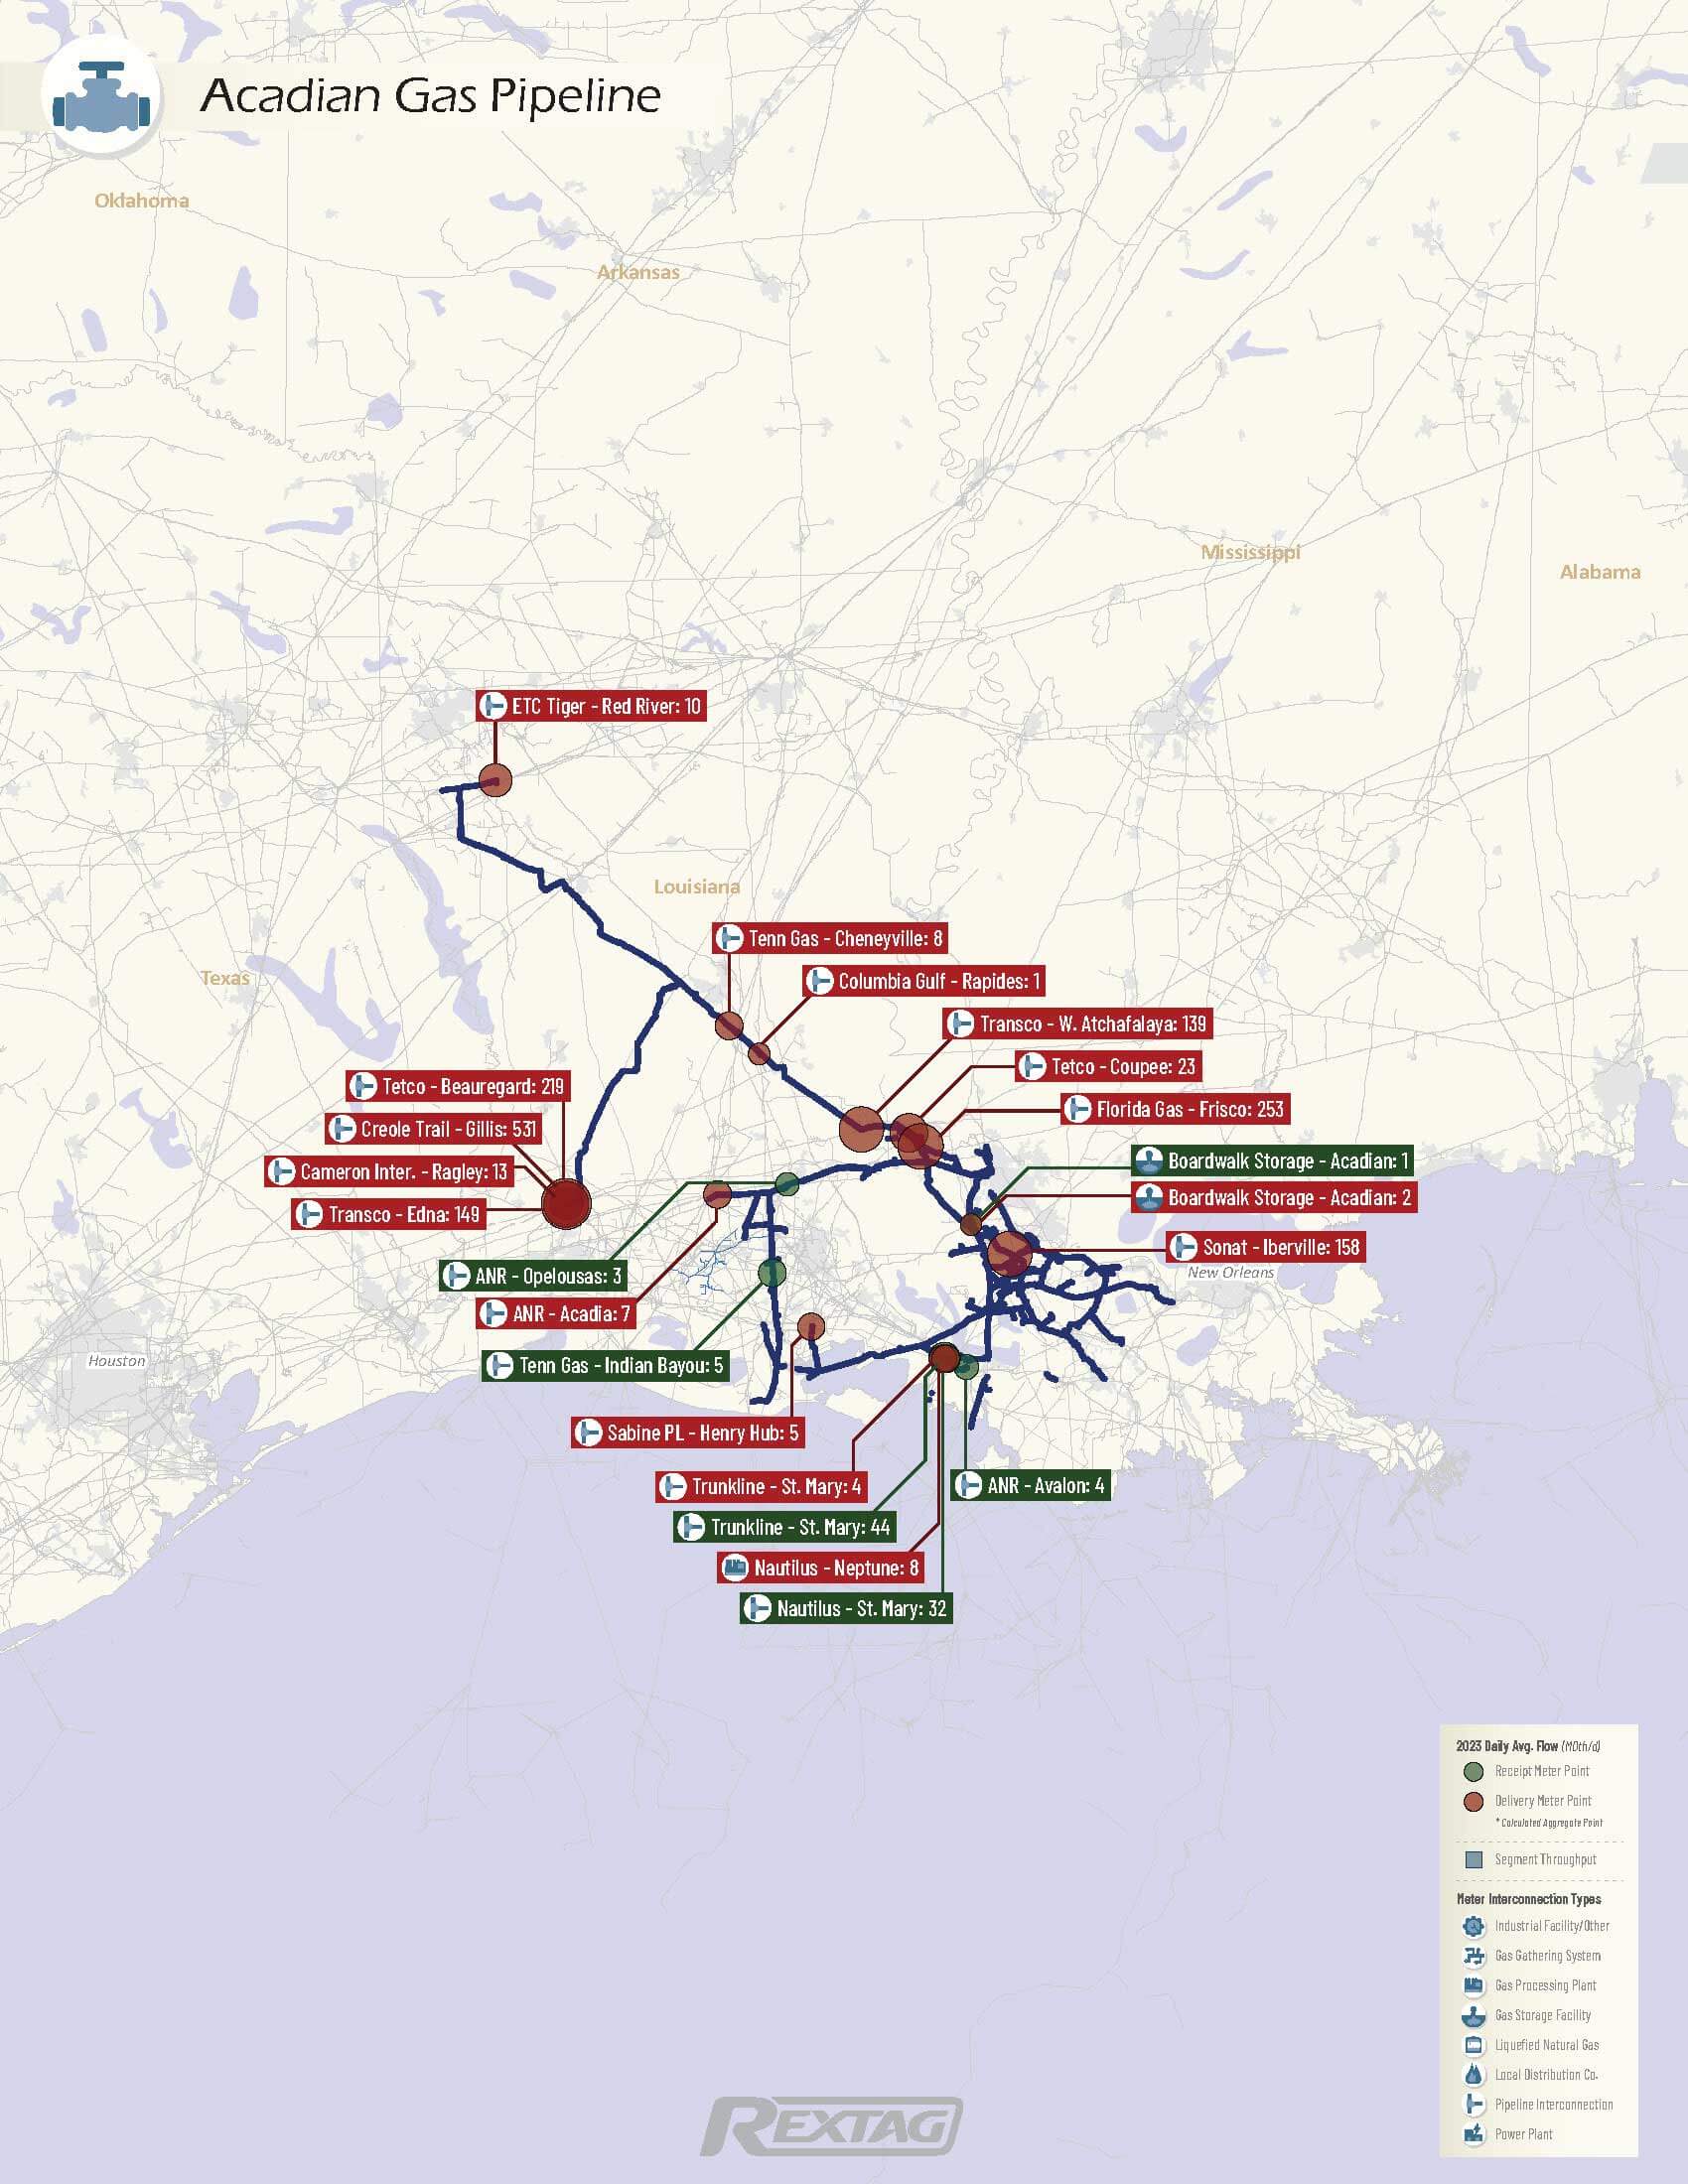
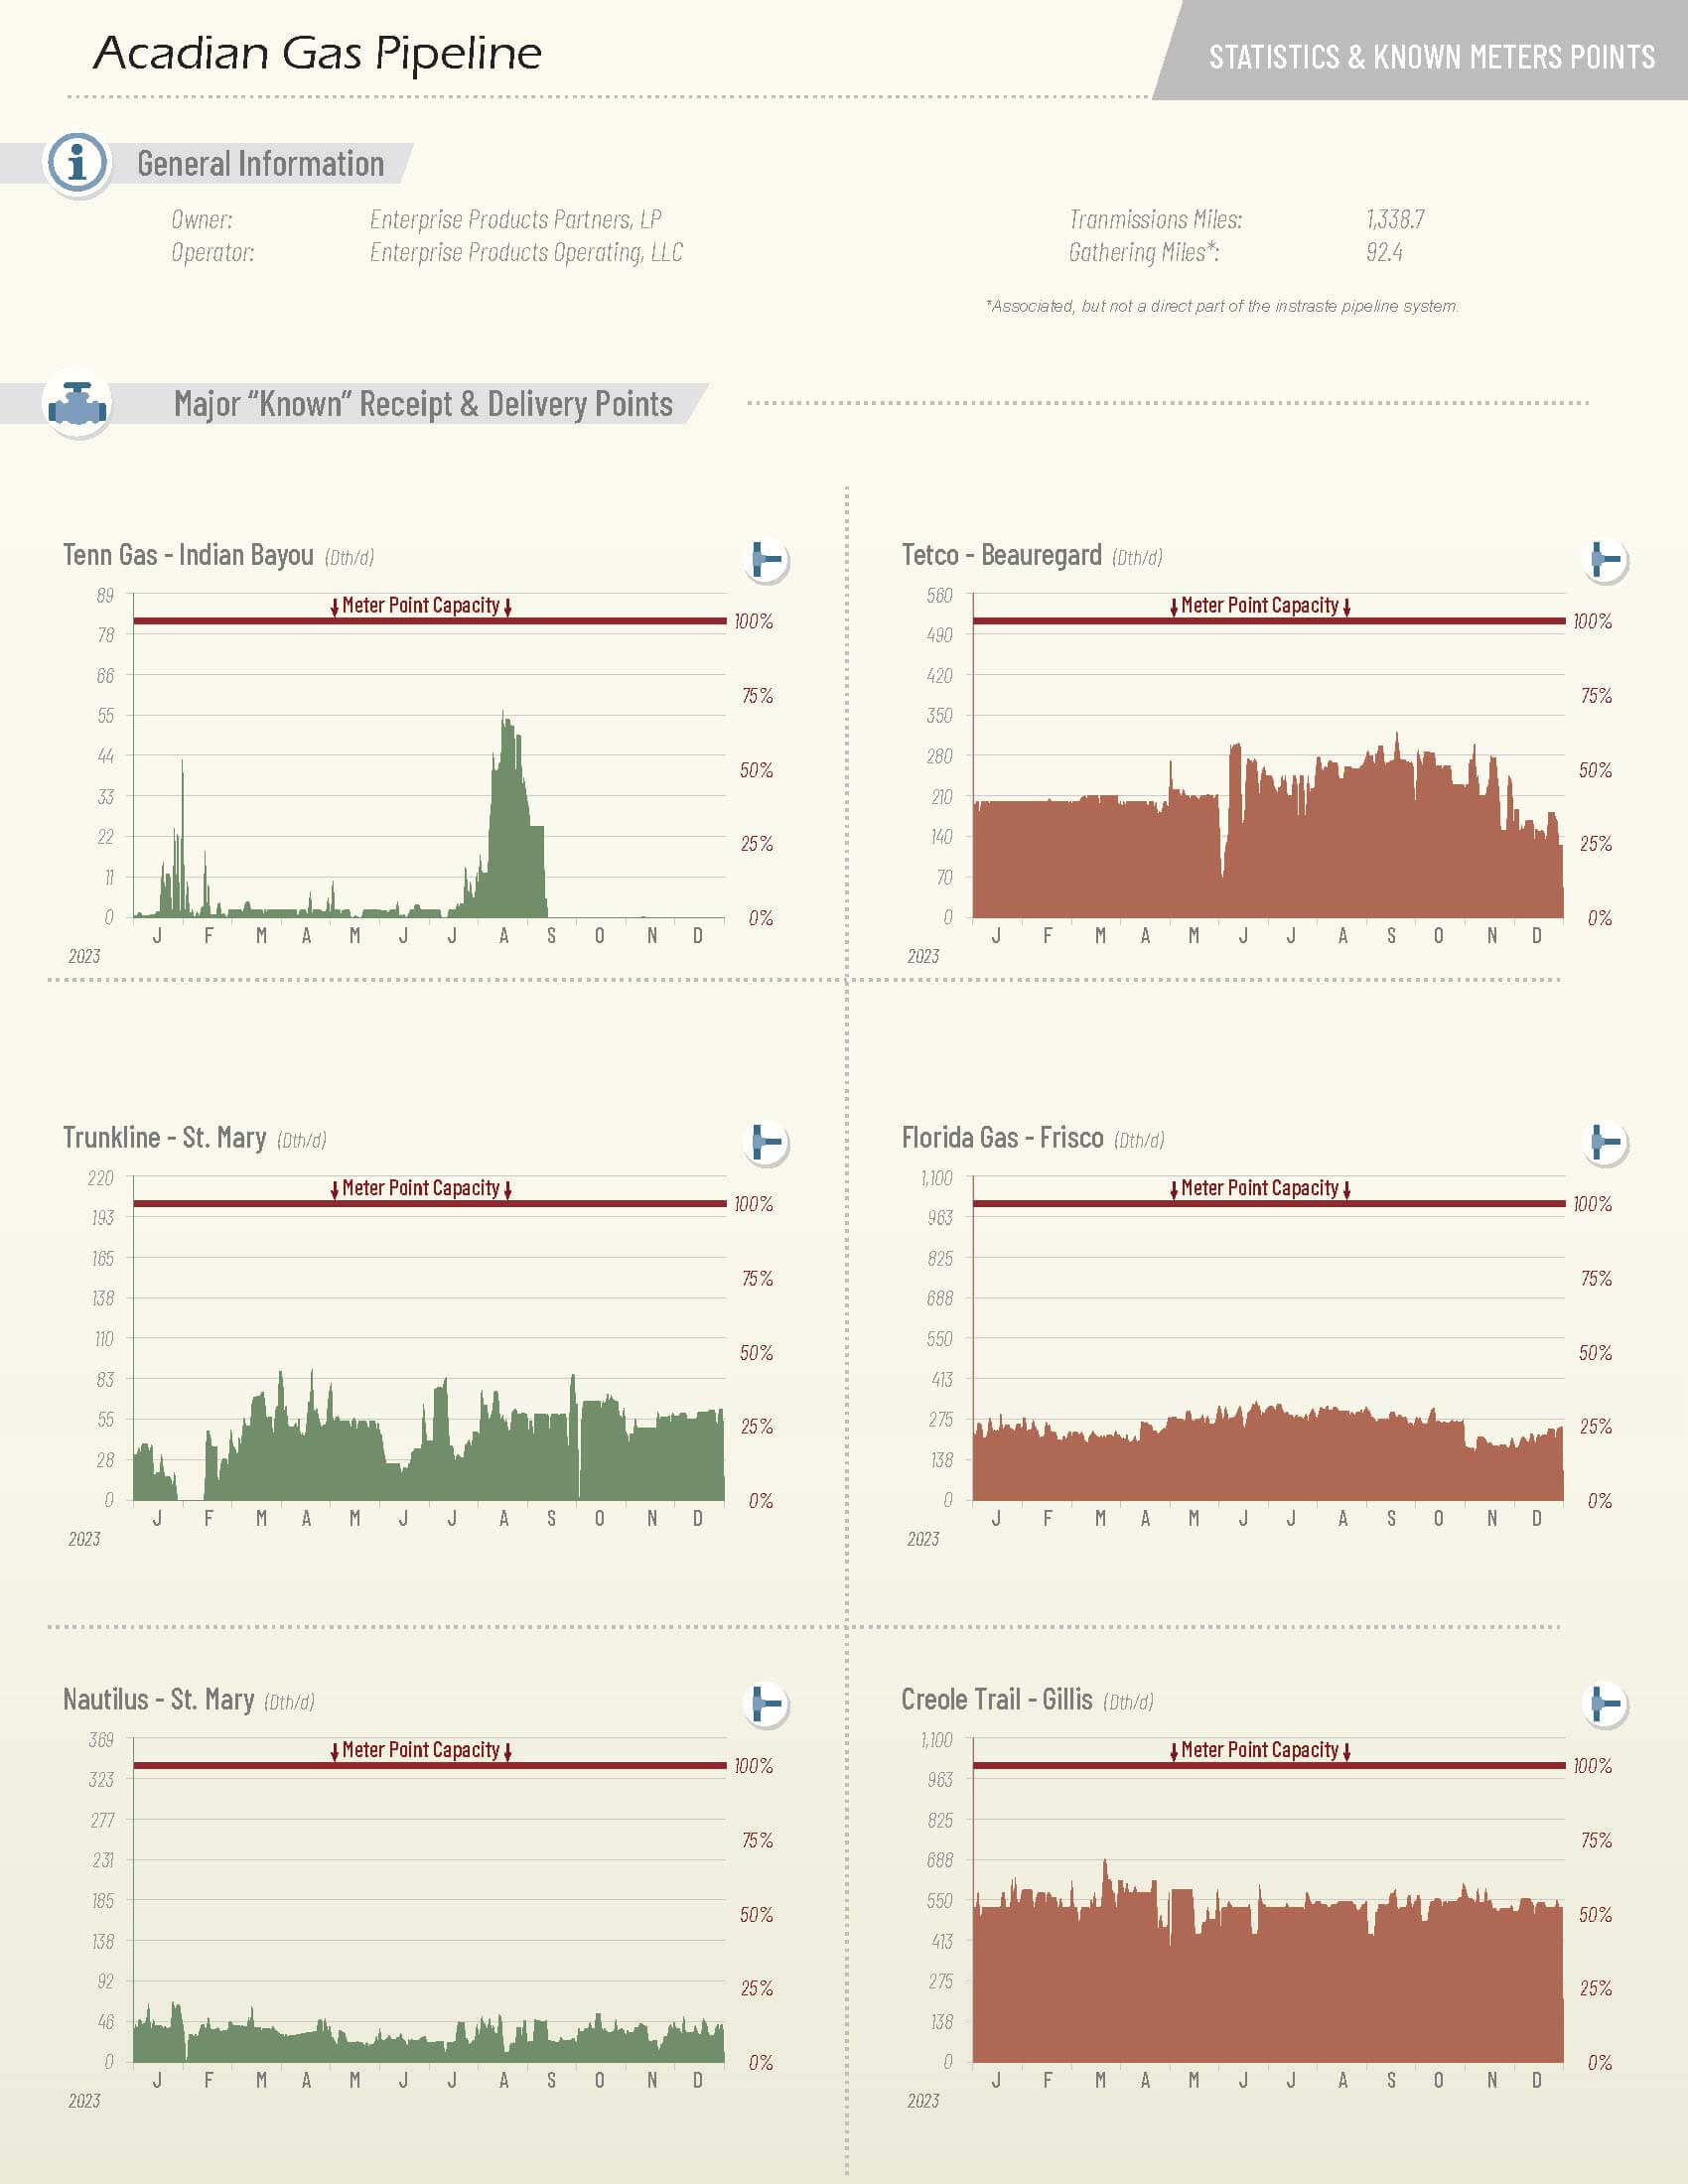
In this section, we are covering the often "hidden" world of intrastate pipelines. Unlike the regulated interstate assets in the previous section, intrastates are not required to report on their gas flows and activities, and as such, that information is virtually impossible to come across. Intrastate pipelines are defined as pipelines that operate within their state borders and, for the most part, are not involved in the transportation of natural gas between states or otherwise supporting the transportation of natural gas between other interstate regulated pipelines. At Rextag, however, we have comprehensive information on their physical infrastructure, and we can, with the help of their interconnections with other regulated interstate pipelines, infer some of their internal workings. In this section, we have selected their known interconnections with interstate pipelines and displayed their assets on a map with their annual daily average flows for those points. It's important to note, however, that in some cases, and especially in Texas, a significant portion of their receipts and delivery volumes are not available in the public domain and are therefore missing in this book. This section, however, is intended to showcase large intrastate infrastructure assets and how, in some cases, they contribute significantly to the transportation of natural gas in the United States.
LNG Export Terminals
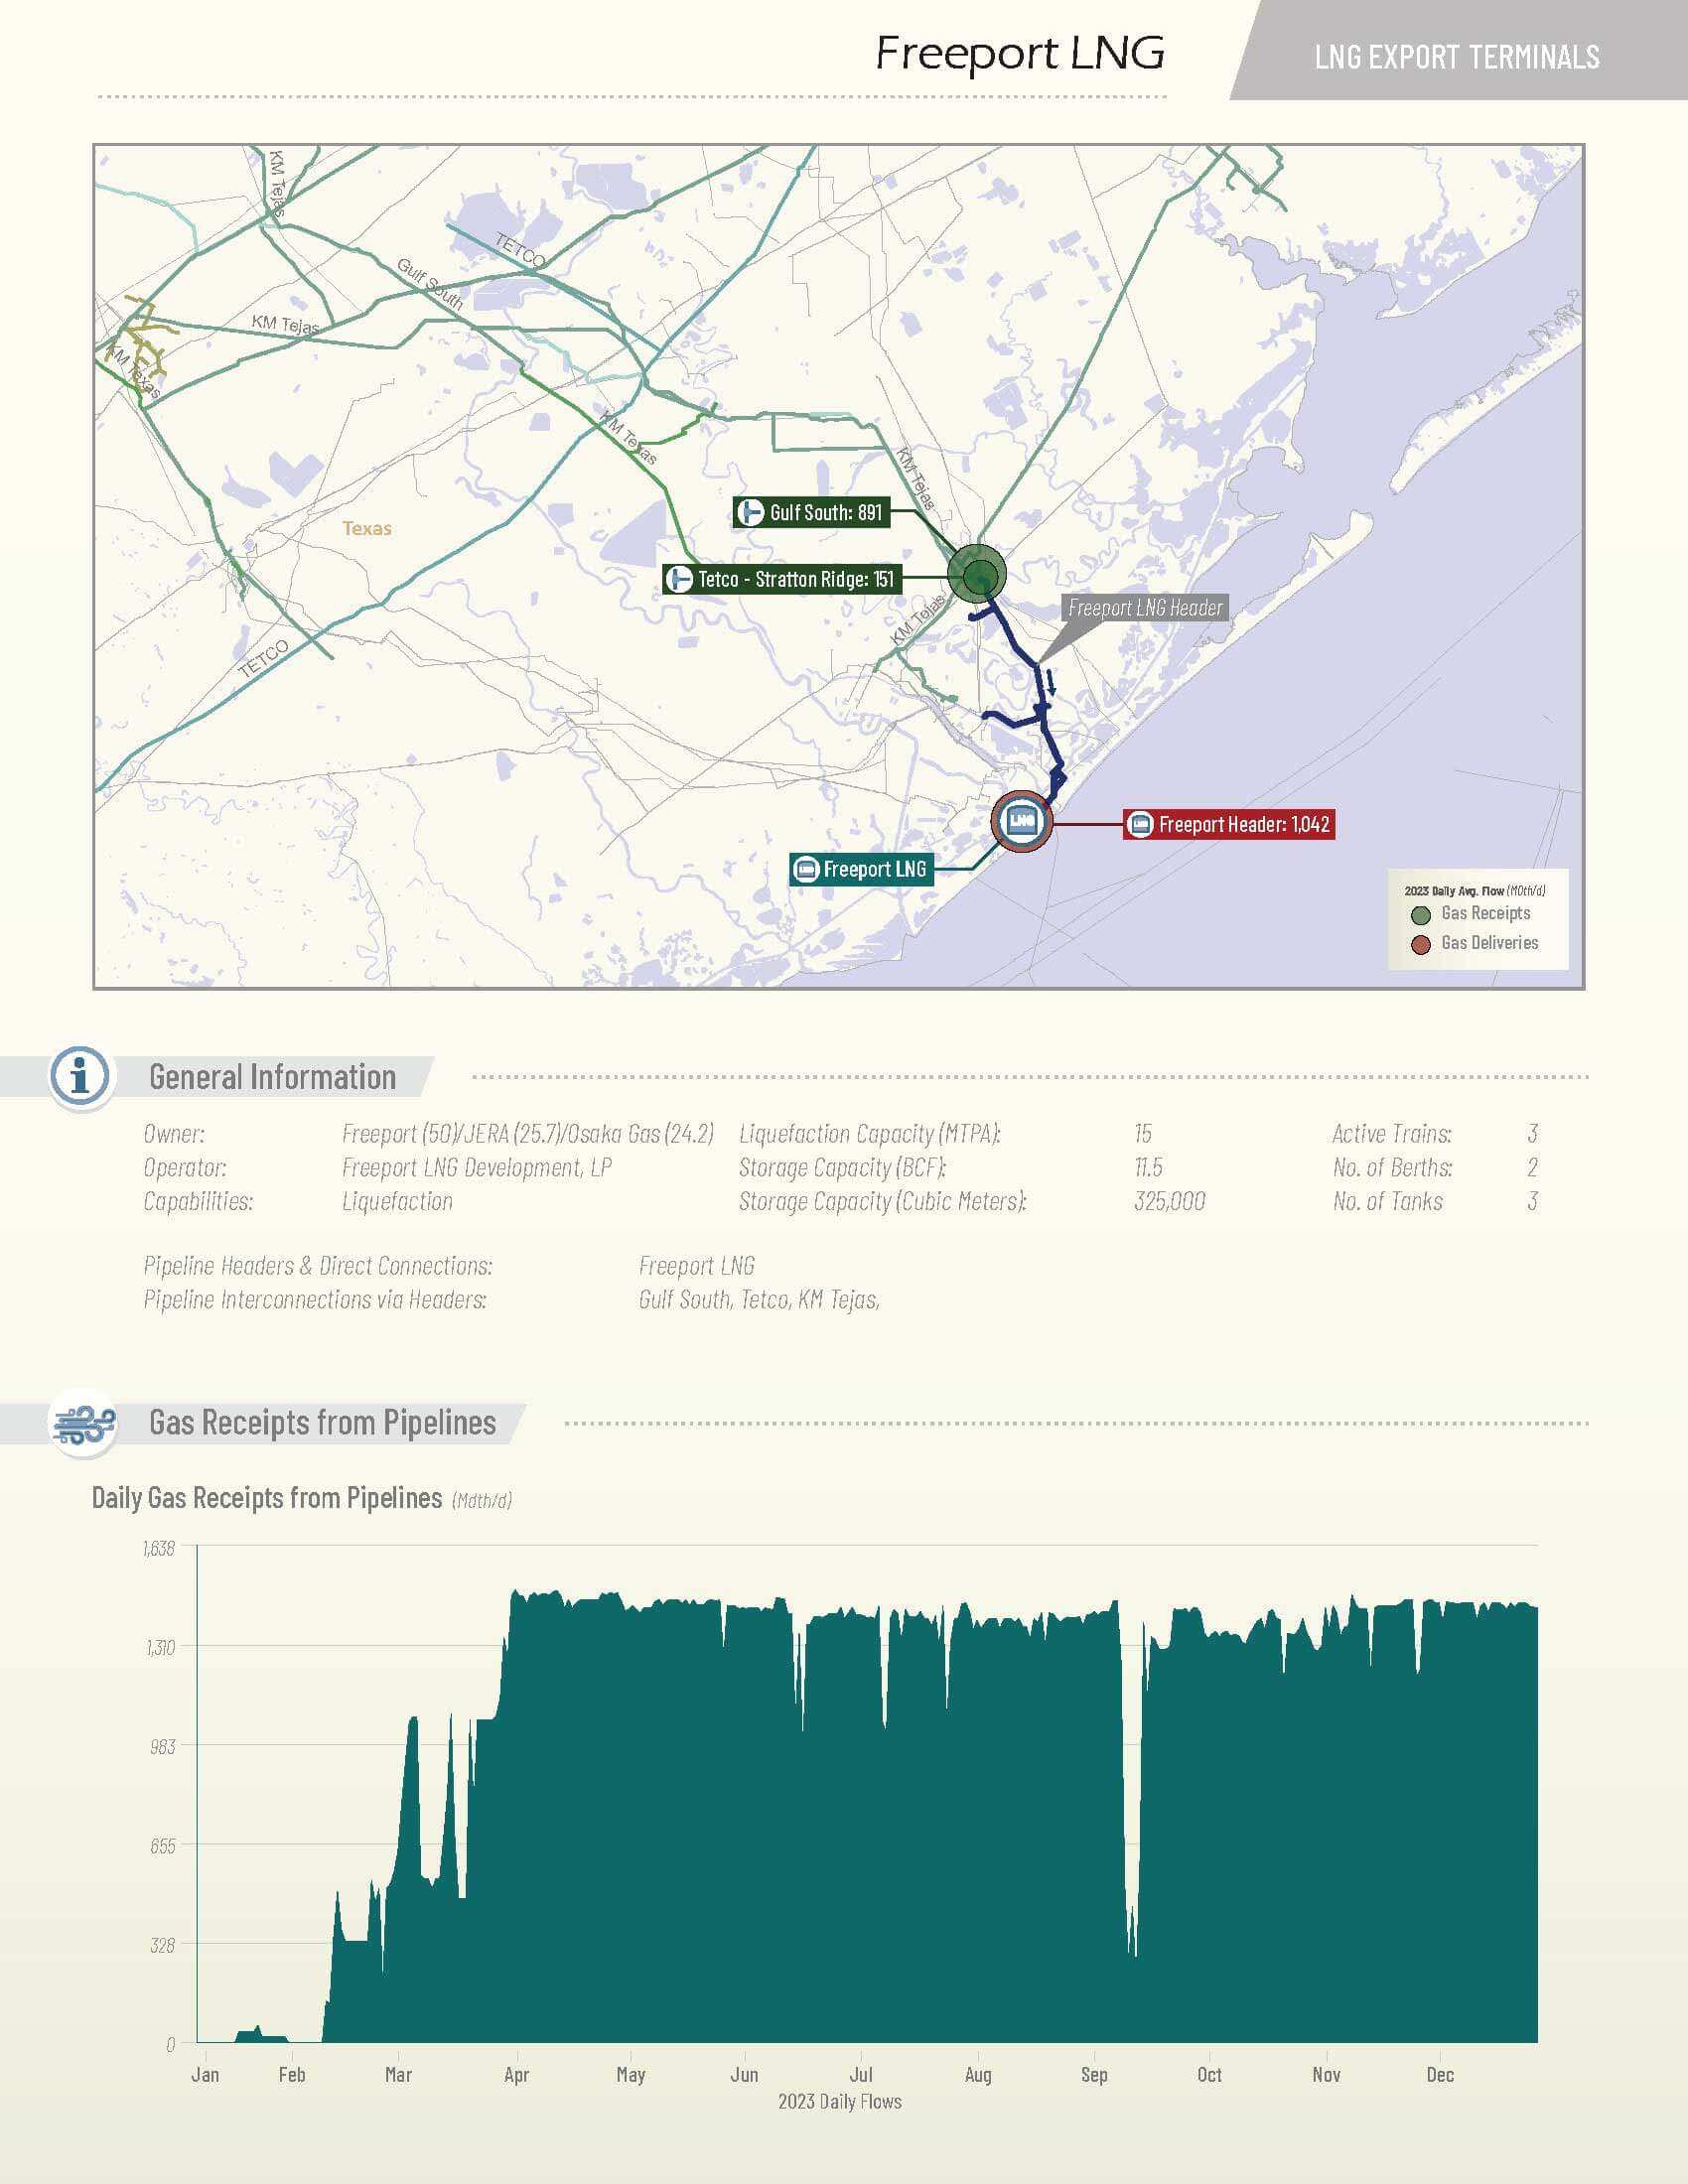
This LNG Export Terminal Section is expected to grow in importance over the next few years as the US is slated to become a major global player in natural gas exports, with a record number of expansions and new facilities coming online in the near future. Many of these facilities here currently have expansions underway, and for the sake of consistent presentation, we have limited ourselves to existing infrastructure as of the printing of this book. The selection here is currently limited to active LNG terminals with throughput volumes found in interstate informational postings sites and other public sources.
Natural Gas Market Regions
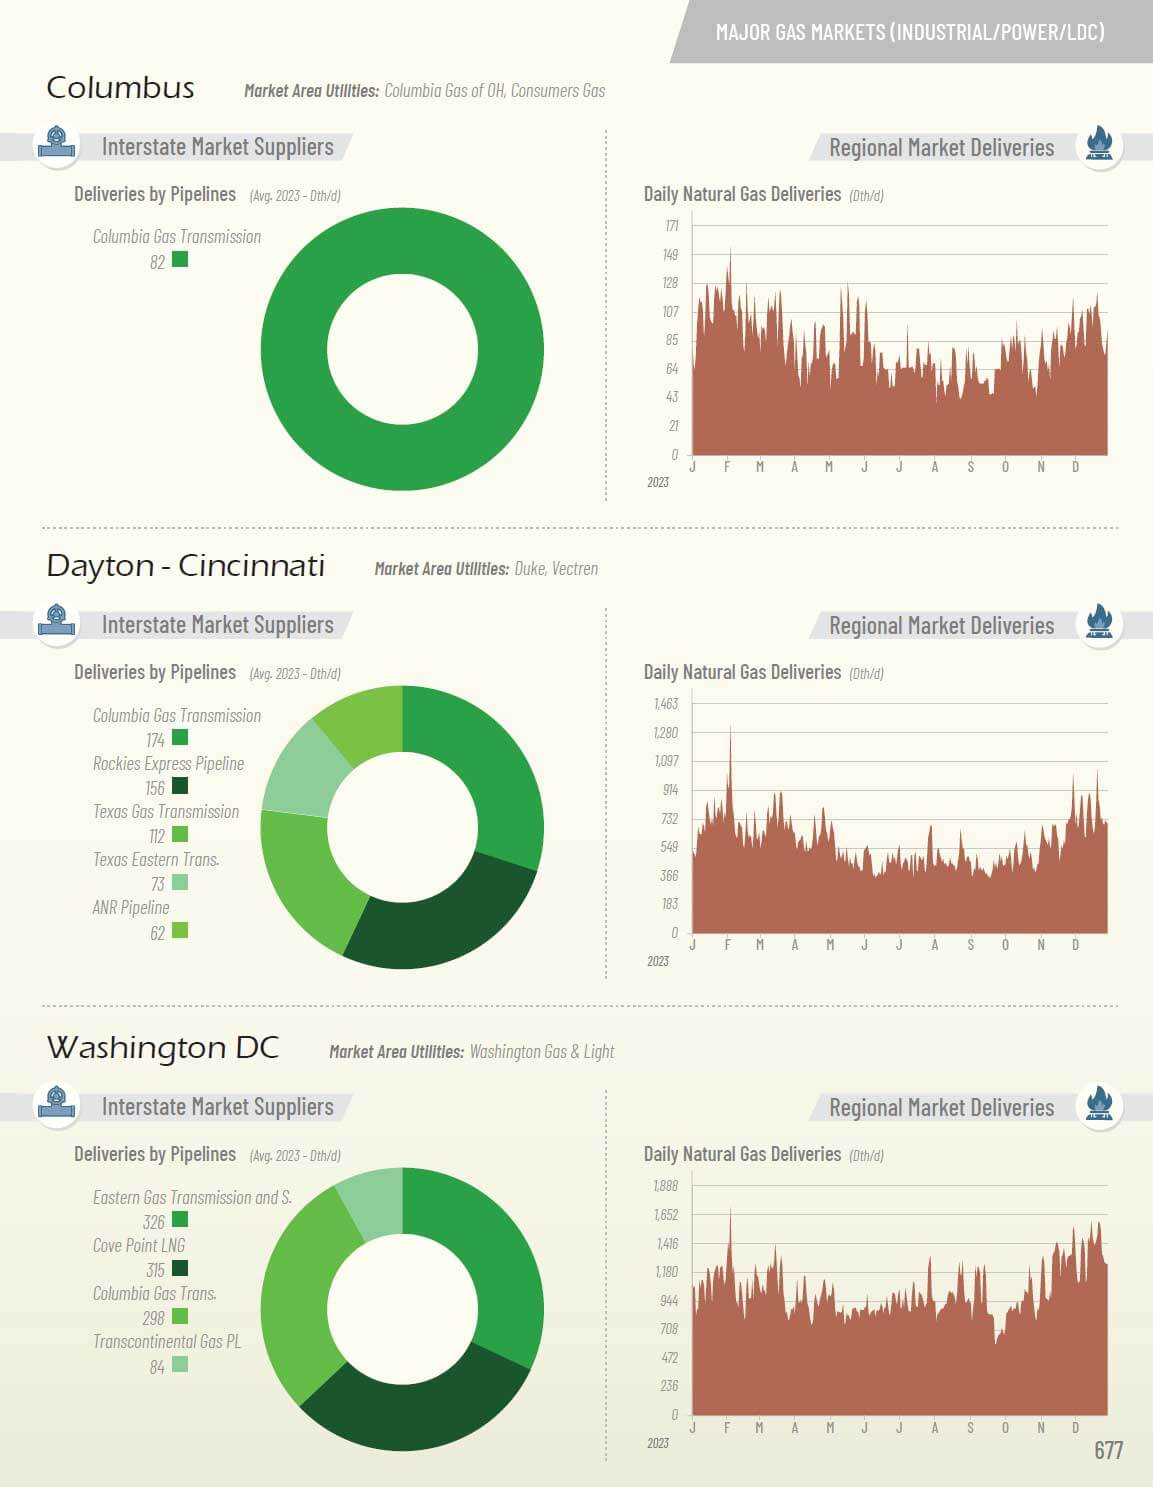
This section of the book addresses the final link in the natural gas market chain, which, coupled with the growing significance of LNG exports to global markets, places U.S. consumer markets at the forefront. These consumer markets constitute the demand, serving as the engine that propels all other sections in this book. We have systematically examined the extraction, processing, transportation, and now the distribution at the 'burner tip' of natural gas. In this context, we have focused on meter points from various interstate pipelines as they deliver gas into regional markets.
For simplicity, we have used city names to discuss these markets, although it's essential to note that these do not necessarily represent 'city limits.' Instead, they serve as a convenient term to address a region based on the largest urban area within that region. Nonetheless, it is anticipated that the vast majority of the gas reported will be consumed by the larger city representing the name of the market.
In this report, we have aggregated all deliveries from interstate pipelines considered 'burner tip,' encompassing the conversion of natural gas into energy. This includes deliveries to Local Distribution Companies (LDCs), Industrial Consumers, and Power Plants. Unfortunately, an area where we have limited to no visibility using meter points is in Texas, Oklahoma, and Louisiana. Consumer markets in these areas are primarily served by interstate pipelines, and as discussed in the Intrastate section of this book, data for these regions does not exist in the public domain.
.svg)