The Natural Gas Reports is the re-imagined Natural Gas Data & Map Book and it has been integrated as the latest component of the GeoWeb Portal, our web-based mapping application. With live, dynamic and interactive features and data, the Natural Gas Reports combines the practicality and ease of use of the printed book with the power of nearly 50 million data records on interstate natural gas pipelines and facilities across the United States. Basically, the Natural Gas Reports is a constantly updated natural gas pipeline map, from which users can access an immense amount of information, at a click of a button.
The Natural Gas Reports allows users to access up to date and historical daily gas flow and capacity information, dating back to 2008, for more than 20,000 interconnections. For those familiar with our book, all the charts and pipeline information are still present in the Natural Gas Reports, with the added benefit of real-time reporting. Users of this application will now be able to create their own charts dynamically relying on current data and not static end of year summaries.
One subscription is good for up to 5 users!
Benefits at a Glance
Pipeline and Interconnection Point Mapping
Map interstate pipelines and their interconnection points in a powerful and easy to use mapping interface
Use common mapping tools to analyze selected infrastructure: zoom, pan, measure, identify and label
Choose from 7 different background maps to suit your needs with roads, aerial photography, topography, and more
Export the maps you create to an image file to print or use in your presentations
Flows & Statistics
Look up natural gas flows, designed capacities and utilization by individual pipelines or individual interconnections, for a specific date or range of dates
Chart and print historical charts with flow data or extract the data to use in Excel or other spreadsheet/database programs to analyze and create custom reports
View and print statistics for more than 130 pipelines and storage facilities including:
Information on owner, operator, miles of pipeline, system capacities, seasonal storage and compressor stations
Summaries for customer contracted transport and storage capacities by expiration year
Annual financial highlights with per-year revenues and net incomes
Annual gas throughput and storage quantities
Contracts
Search for transportation and storage contracts by pipeline and refine your search by the contract expiration date
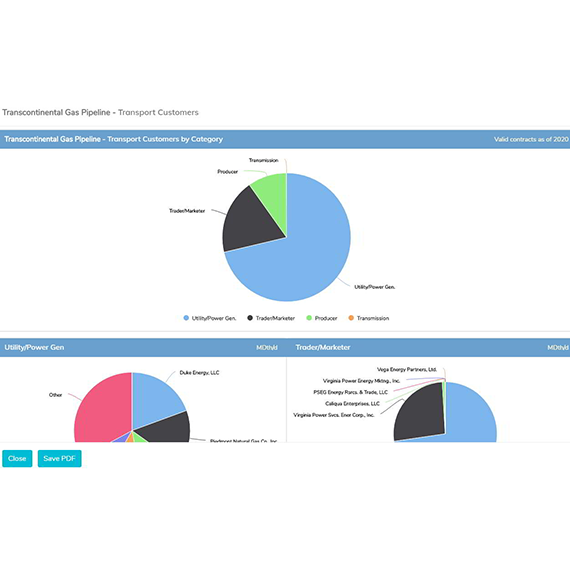
View and print a graphically compiled summary of transport and storage contracts by the type of shipper (utilities, producers, marketers, transmission and industrial)
Query a pipeline’s shippers with contracted capacity or query a shipper’s current and expired contracted capacities