
Connect Infrastructure,
Flows, and Market Insight
Stop piecing together answers from multiple sources

Analyze the Natural Gas Market as a Connected System
Join us to explore how to
- Analyze supply, flows, pricing, production, and demand across a selected market
- Follow gas movement across pipelines, interconnections, and downstream markets
- Investigate constraints, capacity shifts, and changing system conditions
- Add contract, shipper, operator, and commercial context to infrastructure analysis
- Move from fragmented research to a more complete market view
Analyze more of the gas market in one place
Understand Supply Conditions in a Selected Market Area
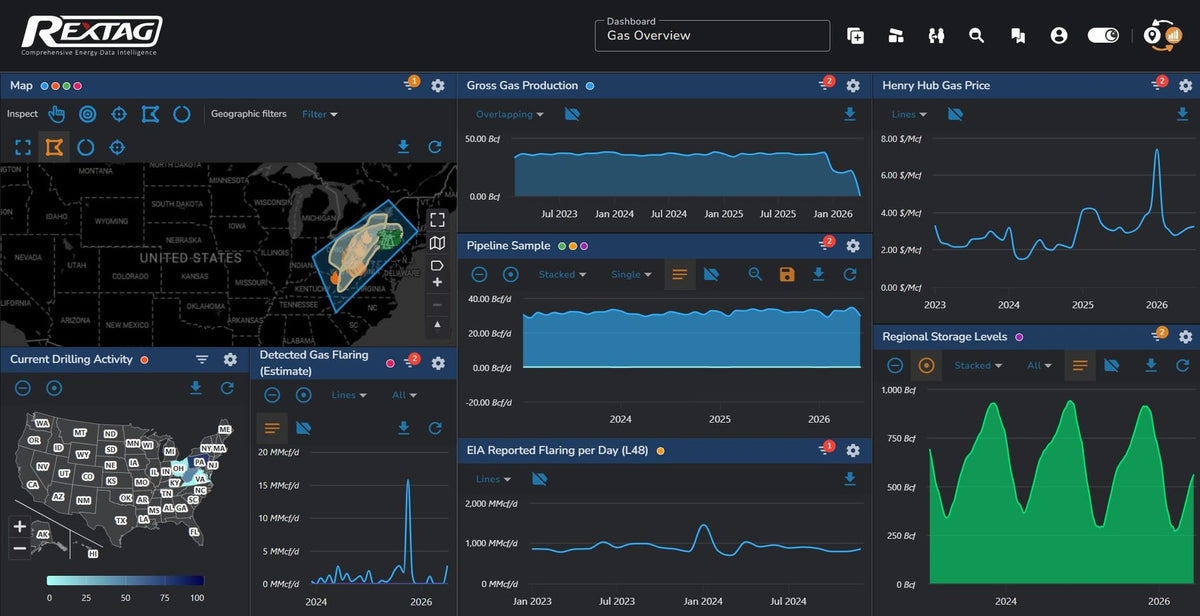
Evaluate Whether Local Pipeline Capacity Is Accessible
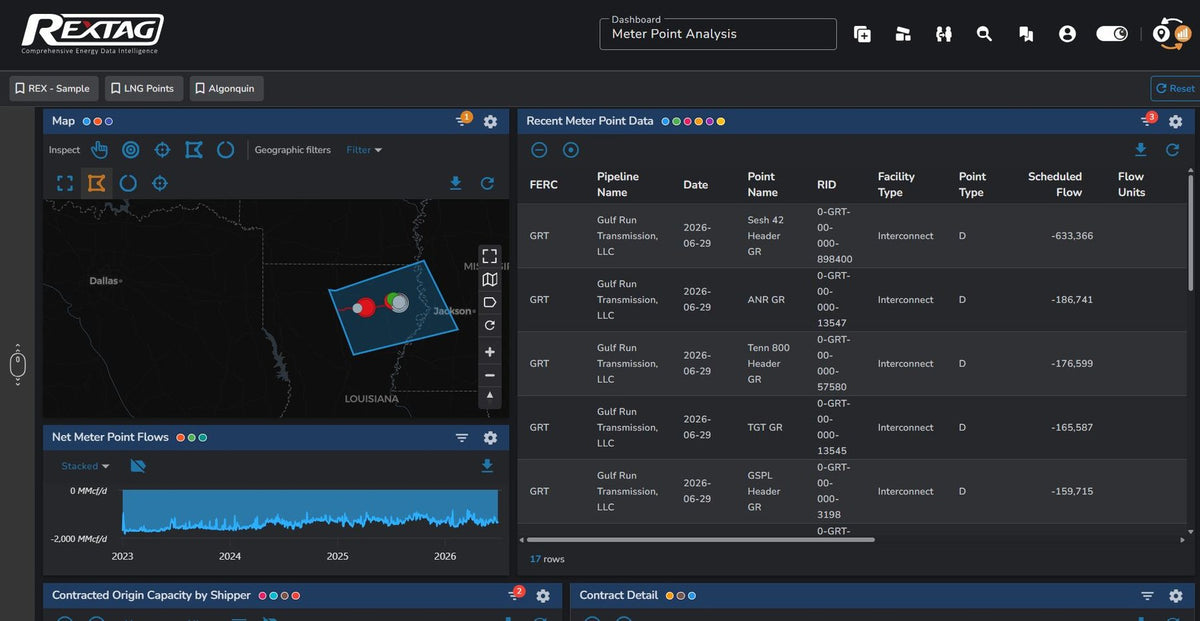
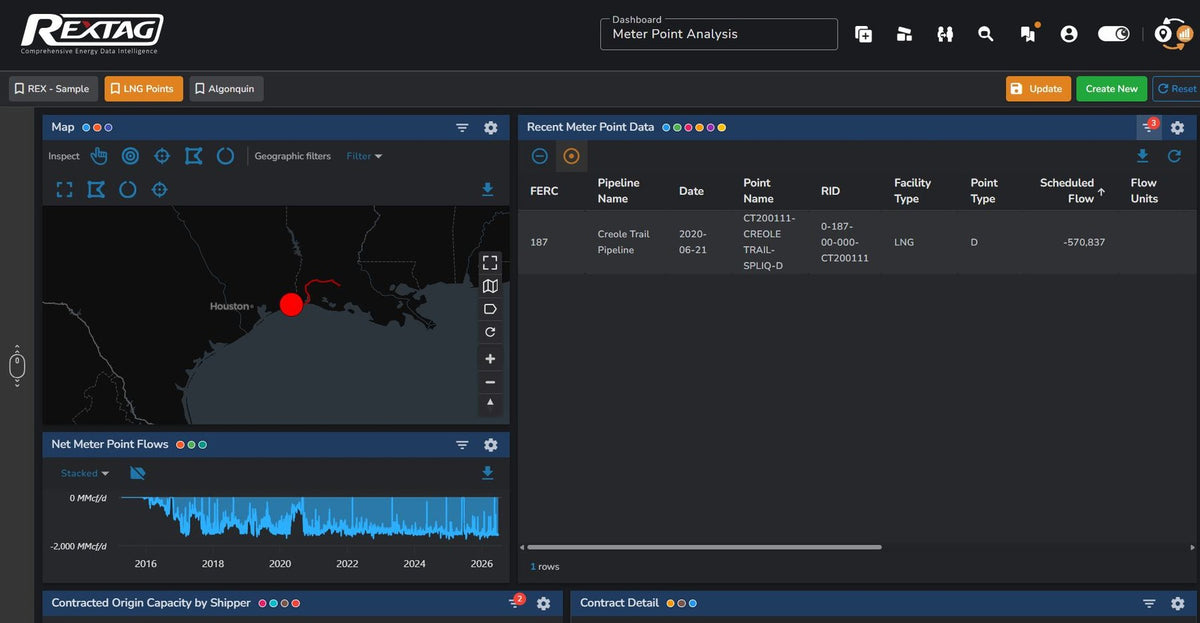
Understand Flow and Contract Position at a Specific Meter Point
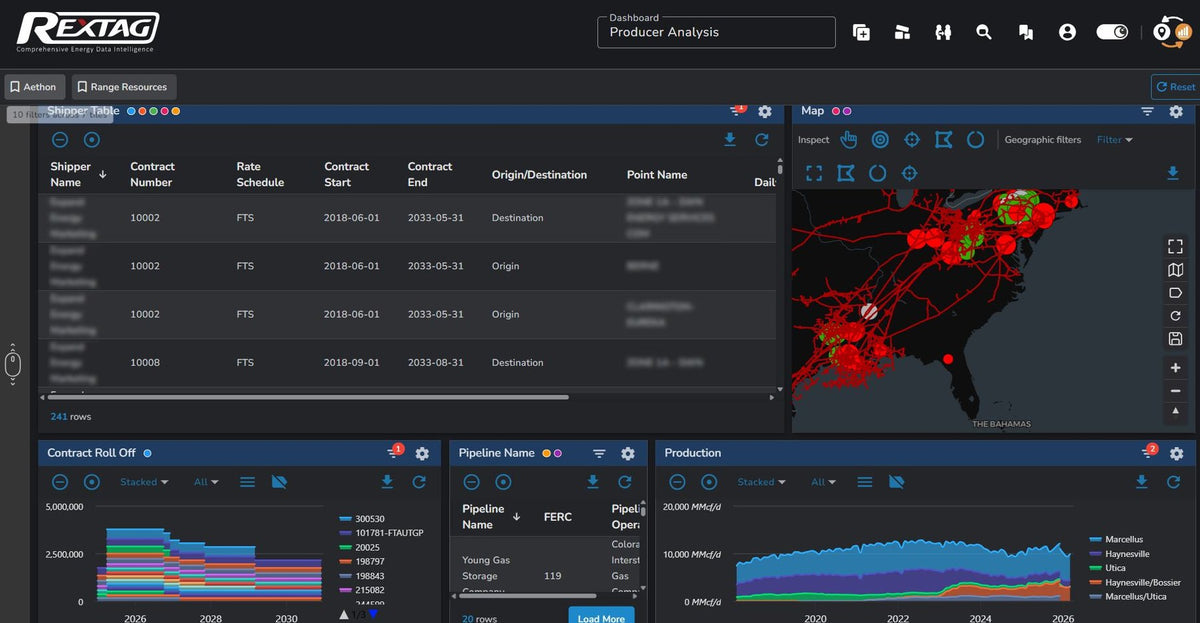
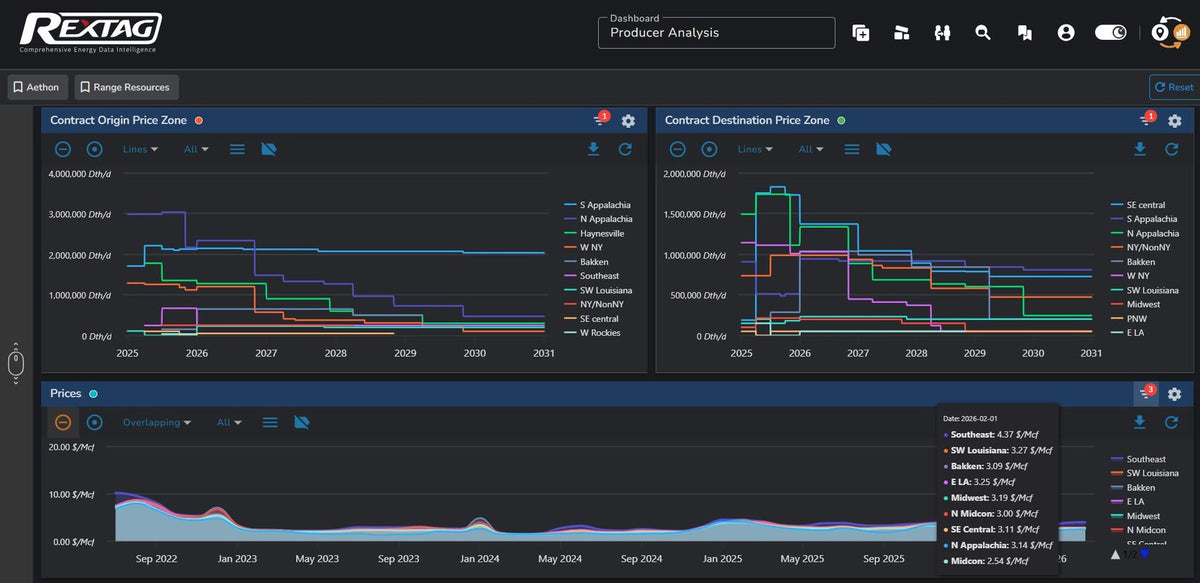
See How a Producer Moves Gas to Market
Compare Contract Routes Against Regional Pricing
Compare shippers’ transportation and market-access strategies to evaluate how route selection and regional pricing shape commercial position.
Alex Gafford
Director, Midstream intelligence
Rextag

Rey Tagle
President
Rextag

Who is this webinar for?
Whether your team is evaluating market exposure, commercial strategy, asset performance, site viability, or investment risk, Rextag helps bring the physical and commercial picture together.

Commercial & Market Analysis Teams
Analyze market movement, capacity, contract exposure, pricing context, and infrastructure constraints in one connected workflow.

Midstream & Upstream Teams
Evaluate takeaway, deliverability, utilization, contract risk, and infrastructure-backed opportunities across systems and corridors.

Power & Data Center Teams
Screen locations, corridors, and fuel supply exposure with gas infrastructure, power context, demand growth, and system constraints in view.

Investment & Strategy Teams
Assess asset positioning, infrastructure risk, revenue exposure, and market opportunity with better context around how gas actually moves.
Why you should attend
See what becomes possible when precise spatial intelligence and deep commercial context are brought together.

Stop Piecing Together Difficult Natural Gas Questions
See how complex market questions become easier to investigate when the information you need is connected in one place. Instead of moving between separate maps, pipeline websites, filings, spreadsheets, and market datasets, follow the relationships between infrastructure, flows, contracts, production, pricing, and demand in a single environment.
Spend Less Time Assembling and Cross-Referencing Inputs
Work through supply, constraints, corridors, market position, and commercial questions using connected data. Move from a specific question to the relevant infrastructure, flow, contract, or market context without rebuilding the analysis from separate sources.
See the Market in Greater Depth
Connect detailed infrastructure data with flows, contracts, pricing, production, operators, and market activity to build a more complete view of what is happening across the system.