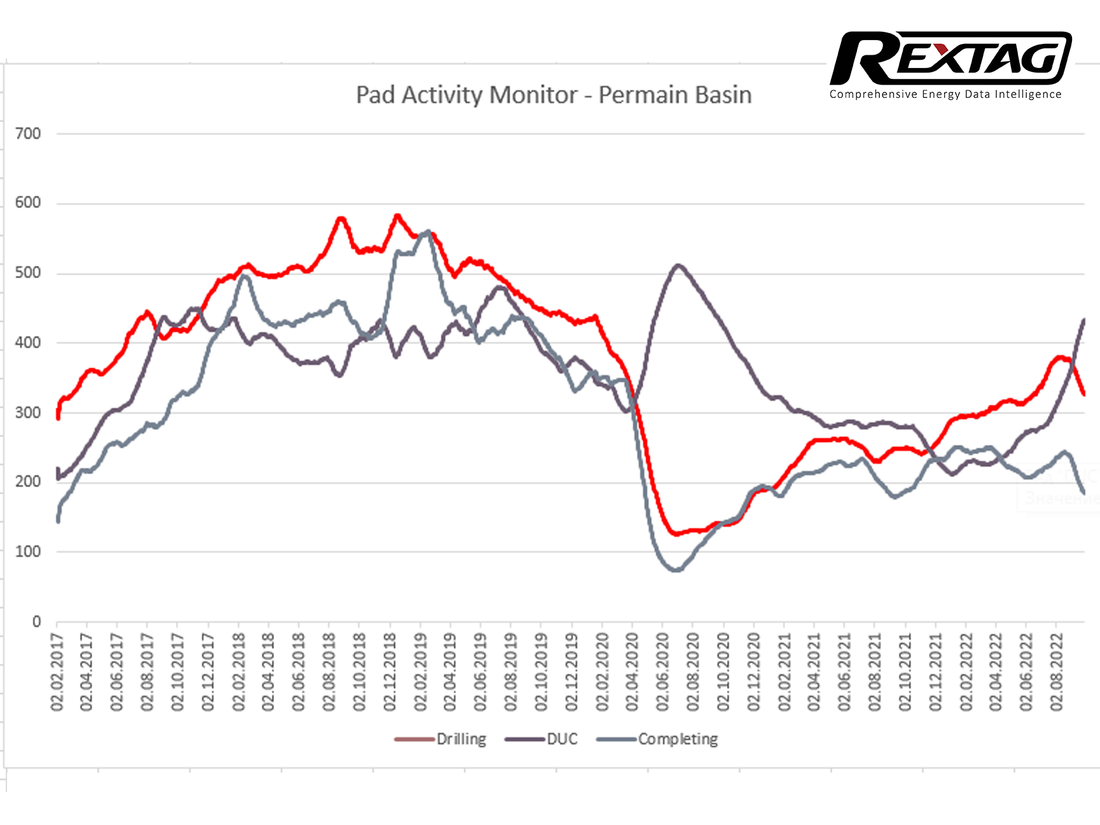
Down 15% Vs. Recently Peaking in Mid-August
In this chart, we can see a constant growth in the number of drillings from January 2017 until December 2018 from about 300 to about 600. Subsequently, there was a gradual decline until March 2020 and the number of drillings decreased to 530.
At the beginning of 2020, the Corona crisis happened and provoked a considerable decrease in production capacity, including drillings which dramatically plummeted to around 130.
Only since August 2020, the quantity of them commenced to slightly raise and they stood still at approximately 240-250 in April-August 2021.
There was a huge uptick in drilling construction in January 2022, which steadily grew up to May 2022
It is important to notice that the number of drillings trended in June and fell in August 2022 and gradually decrease over the last 6 weeks.
More drill-down opportunities for the drilling activity research is provided by Rextag's Pad Activity Monitor (PAM).
Want to see how Rextag’s Energy DataLink works for your team? Click Free Trial to get started, and one of our specialists will walk you through key datasets and workflows.